
IT Operations Analytics
GroundWork Monitor allows you to examine and correlate metrics with Performance Visualization, see data at an organizational level with Views, and drill into specific issues with Log Analysis.
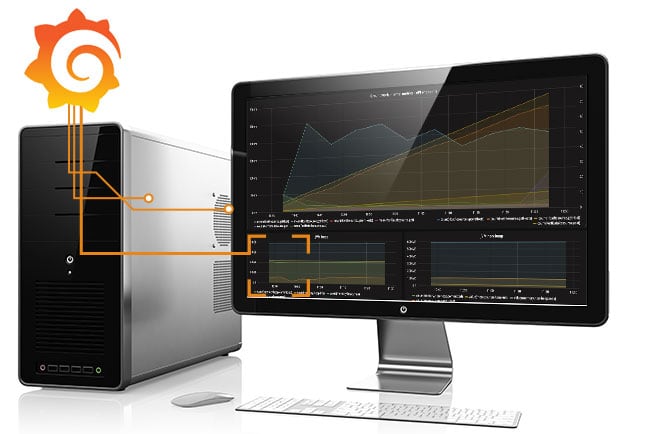
Performance Visualization
Identify choke-points and performance bottlenecks, both short-term and long-term. Integrated Grafana for powerful and flexible visualization so you can create and share time series dashboards of all data or any monitored event.
- Graph any monitoring data metric against any other for comparisons
- Build a dashboard to quickly spot problems
- Identify performance bottlenecks across your entire infrastructure and software stack
- Plan for long-term capacity needs
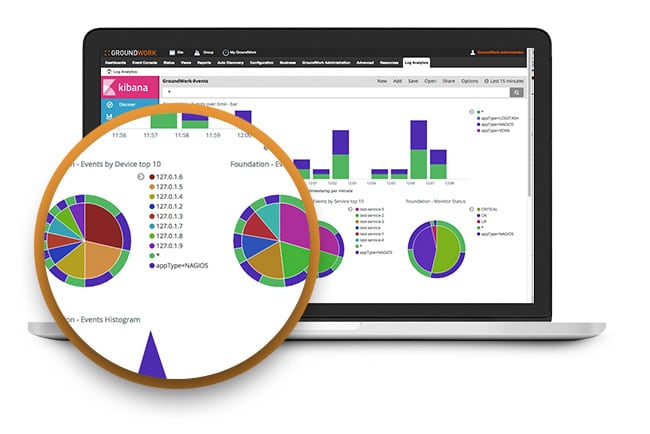
Log Analysis
Event data from a monitoring system alerts you to abnormal behavior, but log data gives you actual root cause analysis. With GroundWork’s Log Bridge, you can combine both to give you the whole picture.
- Bi-directional integration — put selected log data into GroundWork monitor for alerting and GroundWork monitoring data into your log analysis tool
- Combined structured unified monitoring data with unstructured log data
- Monitor for your compliance with regulations
- Don’t have log analytics yet? Deploy GroundWork’s Elastic ELK stack optimized for IT operations
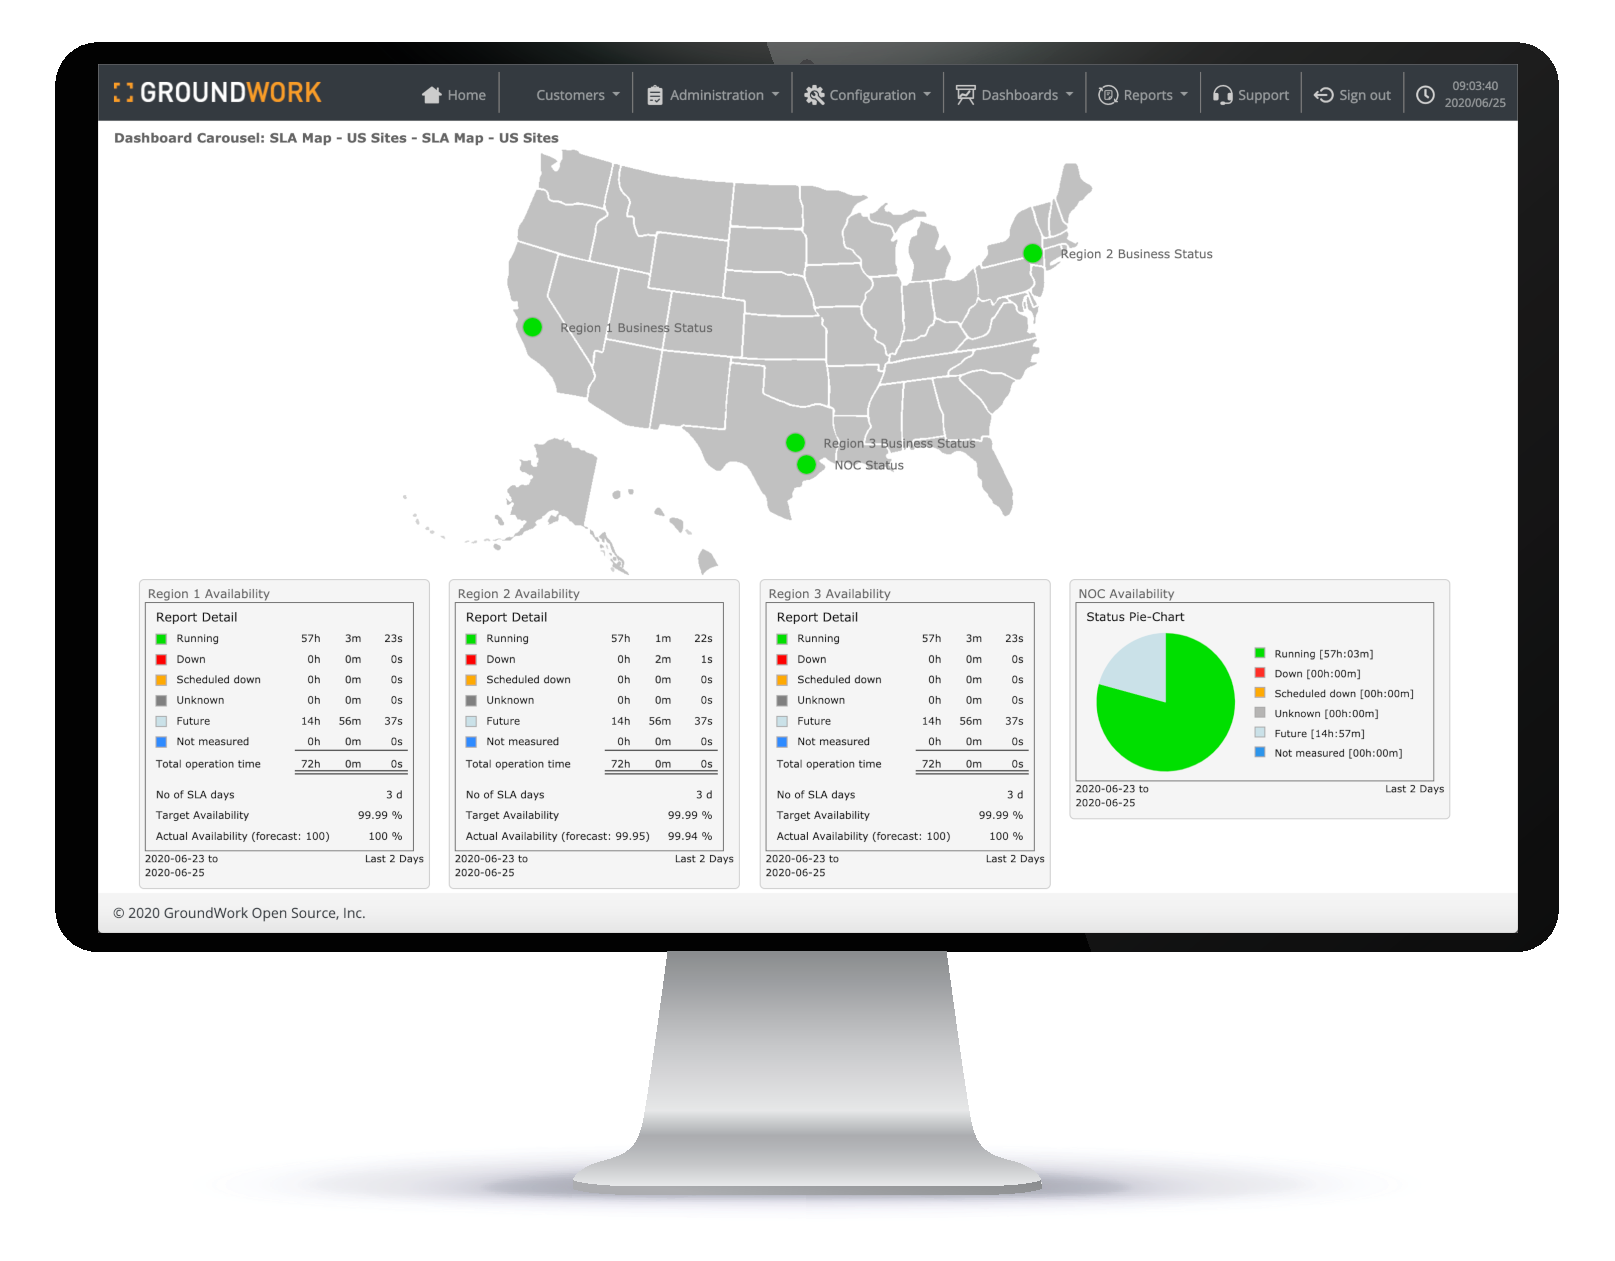
SLAs
Service Level Agreements (SLAs) are the backbone of IT management. The structuring of IT into service delivery and service management organizations under ITIL/ITSM has made the SLA a primary method of setting expectations for services. SLAs are useful for estimating costs and budgets, and to justify and control the frequently high costs of IT services. GroundWork provides a simple, straightforward way to integrate and monitor your SLAs through a series of applications including:
- Business Service Monitoring (BSM)
- SLAs
- SLA Dashboards (shown)
- SLA Reports