Application Monitoring with the Prometheus Client and GroundWork Monitor
October 20, 2020
Prometheus is a popular open-source systems monitoring and alerting project. The project is a member of the Cloud Native Computing Foundation, joining in 2016 as the second hosted project, after Kubernetes. In this blog, we will demonstrate how to implement Application Performance Monitoring (APM) using the Prometheus GoLang client libraries API and de-facto standard data transport model to feed monitoring metrics into the GroundWork Monitor 8 server. Since we are doing application performance monitoring, this article will have coding examples.
Prometheus has become a very popular instrumenting library for measuring application performance in microservices, especially in Cloud Native applications. Typical measurements in microservices are instrumented on application end points, measuring request count and response time metrics.
Before we get started writing code, let’s introduce the Prometheus metrics basics.
Prometheus Model: Metrics and Labels
The Prometheus model has four kinds of metrics:
Counter: A cumulative metric that represents a single monotonically increasing counter whose value can only increase or be reset to zero on restart. For example, you can use a counter to represent the number of requests served, tasks completed, or errors.
Gauge: A gauge is a metric that represents a single numerical value that can arbitrarily go up and down.
Summary: A summary captures individual observations from an event or sample stream and summarizes them in a manner similar to traditional summary statistics: 1. sum of observations, 2. observation count, 3. rank estimations.
Histogram: A histogram samples observations (usually things like request durations or response sizes) and counts them in configurable buckets. It also provides a sum of all observed values.
Metrics are created by programmers instrumenting their code, taking data point sample measurements at a point in time. Adding this code to applications is becoming standard practice. This post includes a simple application with metrics added.
Metrics have a name, a sample value, and one or more labels. Labels are name value pairs representing different dimensions on a metric.
The data model is very simple, yet very expressive. Let’s start with a simple example. Using the Prometheus Go client library, we can create a counter with minimal effort. You just need to include the Prometheus client library in a GoLang program:
The Prometheus GoLang library is the API to instrument your application. The API has new methods to create the four kinds of metrics. Here is a minimal example of creating a counter metric, only requiring the counter metric name:
We can optionally give that counter a description:
simpleCounter = prometheus.NewCounter(prometheus.CounterOpts{Name: "request_counter",Help: "Finance Server total http requests counter", })
And then give that counter constant labels:
simpleCounter = prometheus.NewCounter(prometheus.CounterOpts{Name: "request_counter",Help: "Finance Server total http requests counter",ConstLabels: prometheus.Labels{"resource": "FinanceServicesGo","group": "PrometheusDemo", }, })
Metrics must be registered, which is a 1-liner in Go:
registry.Register(simpleCounter)
Then they are ready to be instrumented. Here, in a typical GoLang REST Service handler, we can increment our simpleCounter metric with every request:
func handler(w http.ResponseWriter, r *http.Request) {simpleCounter.Inc() ...}
That’s the basics of creating a simple metric.
So how do we get our metrics sent to the GroundWork Monitor servers? The answer is simpler than you might think. You don’t have to send (push) metrics. In fact, although Prometheus supports pushing metrics with their API, it is not the recommended method. Instead, metrics should be pulled from the server being instrumented. Prometheus will handle packaging your metrics in a soon-to-be standardized format called Exposition (Open Metrics) so any connector or agent can pull metrics from your application. In GoLang, it is once again a one liner:
http.Handle("/metrics", promhttp.Handler())
All of the examples in this blog will demonstrate pulling metrics. Note the Prometheus API, by default, provides a set of GoLang default metrics, such as low level memory and Garbage Collection (GC) values. In our examples, we turn off the default metrics by creating our own metrics registry. Before we get further into the examples of metrics, let’s first take a quick look at the architecture.
GroundWork Monitor Architecture
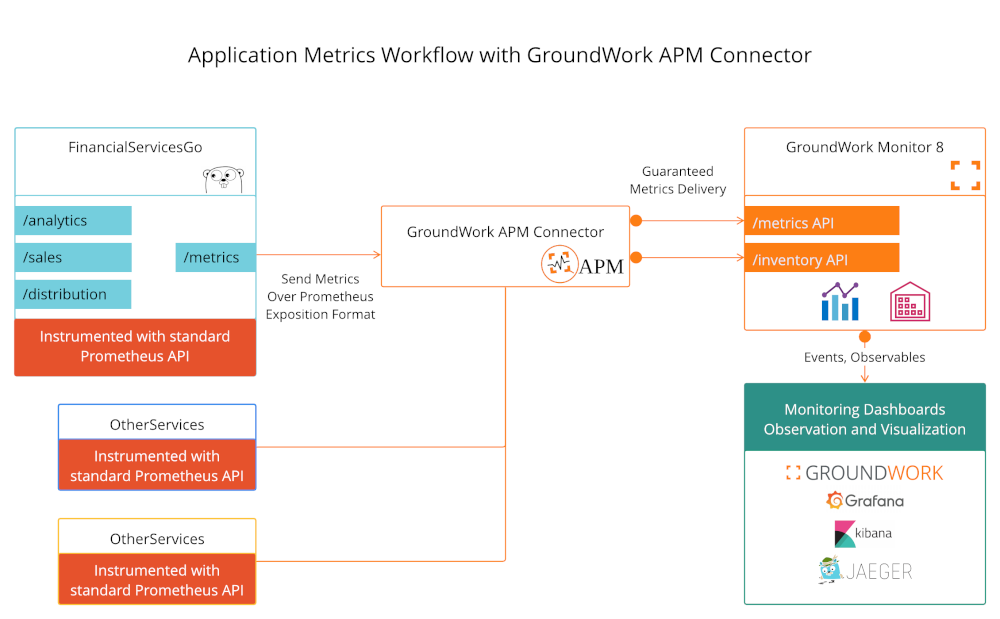
GroundWork Monitor 8 introduces a connector architecture for gathering metrics from a diverse set of sources. The APM Connector adds to the list of supported connectors including Kubernetes, Docker, Elastic, OpenStack, VMware and more. Additionally, we have Cloud Connectors for AWS, Google Cloud Platform and Microsoft Azure.
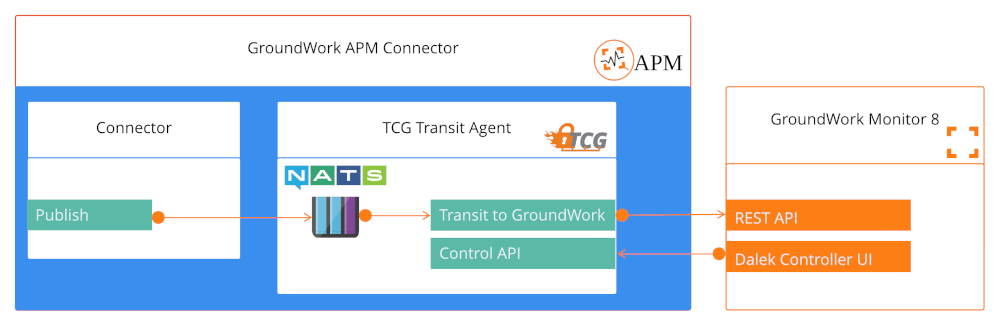
The APM Connector runs between your servers being instrumented and the GroundWork Monitor server. In the diagram below, the APM Connector periodically pulls metrics from our example FinancialServices.
Metrics and Inventory are queued in the connector, and won’t be removed from the queue until they are delivered to GroundWork Monitor. Once they are received by GroundWork Monitor, they are immediately made available to the GroundWork Monitor dashboards, as well as other visualization applications like Grafana, Kibana and Jaeger. All of these visualization UIs are packaged with GroundWork Monitor 8 out-of-the-box.
Coding Examples
In our coding examples, we will instrument and monitor:
One microservice:
FinanceServicesGo
Three endpoints on that microservice:
/analytics
/distribution
/sales
Three metrics per endpoint:
bytes_per_minute
requests_per_minute
response_time (averaged over one minute)
The connector and coding examples are available for cloning in our public Github repository:
To run the example Prometheus instrumented server:
$ cd examples/apm/pull/go$ go build$ ./go
And then to run the Prometheus connector:
$ cd connectors/apm-connector$ go build$ ./apm-connector
Exposition Format
The Prometheus endpoint generates metric payloads in the Exposition format.
Exposition is a text-based line-oriented format. Lines are separated by a line feed character. A metric is defined in a combination of a single detail line and two metadata lines. The detail line consist up of:
Here we use Curl to access our Go server, which exposes metrics on the /metrics endpoint:
curl localhost:2222/metrics
# HELP bytes_per_minute Finance Services bytes transferred over http per minute# TYPE bytes_per_minute gaugebytes_per_minute{critical="45000",group="PrometheusDemo",resource="FinanceServicesGo",service="analytics",warning="40000"} 4215bytes_per_minute{critical="45000",group="PrometheusDemo",resource="FinanceServicesGo",service="distribution",warning="40000"} 26959bytes_per_minute{critical="45000",group="PrometheusDemo",resource="FinanceServicesGo",service="sales",warning="40000"} 13532# HELP requests_per_minute Finance Services http requests per minute.# TYPE requests_per_minute gaugerequests_per_minute{critical="90",group="PrometheusDemo",resource="FinanceServicesGo",service="analytics",warning="70"} 19requests_per_minute{critical="90",group="PrometheusDemo",resource="FinanceServicesGo",service="distribution",warning="70"} 55requests_per_minute{critical="90",group="PrometheusDemo",resource="FinanceServicesGo",service="sales",warning="70"} 1# HELP response_time Finance Services http response time average over 1 minute# TYPE response_time gaugeresponse_time{critical="2.5",group="PrometheusDemo",resource="FinanceServicesGo",service="analytics",warning="2.0"} 2.5response_time{critical="2.5",group="PrometheusDemo",resource="FinanceServicesGo",service="distribution",warning="2.0"} 1.8response_time{critical="2.5",group="PrometheusDemo",resource="FinanceServicesGo",service="sales",warning="2.0"} 0.2
Instrumenting your Application Metrics
Let’s dive into a concrete example of instrumenting your code from the examples directory in our open source Github repository. We will be looking at the pull examples found in examples/apm/pull/go/main.go. To follow along, open up main.go in your favorite editor. First, let’s explore how to create three metrics. These examples will demonstrate gauge type metrics. We use the more advanced Vector Creation APIs, which allow you to create dynamic multi-dimensional labels:
requestsPerMinute = prometheus.NewGaugeVec(prometheus.GaugeOpts{Name: "requests_per_minute",Help: "Finance Services http requests per minute.",ConstLabels: requestsLabels, },dynamicLabels,)
bytesPerMinute = prometheus.NewGaugeVec(prometheus.GaugeOpts{Name: "bytes_per_minute",Help: "Finance Services bytes transferred over http per minute",ConstLabels: bytesLabels, },dynamicLabels,)
responseTime = prometheus.NewGaugeVec(prometheus.GaugeOpts{Name: "response_time",Help: "Finance Services http response time average over 1 minute",ConstLabels: responseLabels, },dynamicLabels,)
Labels can be static or dynamic. All GroundWork metrics must be attached, with a label, to a service. Optionally, you can add labels for Resource (host) and Group. These labels are used for classification in GroundWork Monitor. If you don’t want to set them in code, you can set the resource and group labels in the connector provisioning UI.
GroundWork Monitor works best with warning and critical threshold values per metric. Thresholds are used to determine status of a host or service. Additionally, thresholds, when supplied, are stored in the time series database and displayed by graphing tools like Grafana, so it makes sense to include them in the program. You may want to load thresholds from external sources like a database or flat file in a production context. Here are some examples of labels:
The definition of the metrics and labels are done once in the var and const sections of our main.go app. In the mainline, we create a new registry and register our three metrics with Prometheus. Creating a new registry disables the default Go runtime metrics that are provided with the default registry.
Typically, you will want to instrument an important block of code such as an http request handler or a job running. In our example, we instrument a Go Http handler. First we create the handlers as standard Go http handlers:
And then implement each endpoint handlers for our financial services:
func analyticsHandler(w http.ResponseWriter, r *http.Request) {instrumentedHandler(w, r, "analytics")}func distributionHandler(w http.ResponseWriter, r *http.Request) {instrumentedHandler(w, r, "distribution")}func salesHandler(w http.ResponseWriter, r *http.Request) {instrumentedHandler(w, r, "sales")}
In our simple example, we delegate to a common instrumentedHandler. In this handler we instrument or metrics by:
Starting a timer to calculate the elapsed time (response time for this service)
Add Dynamic labels from runtime information
Simulate the processing of the request with a random metrics generator
Instrument our metrics by setting values on them
Dynamic labels are defined a little differently than static labels. You only need to provide the name of the label at declaration time. At runtime, we provide one dynamic label, the service name (endpoint).
func instrumentedHandler(w http.ResponseWriter, r *http.Request, serviceName string) {// instrument your http handler, start the timer ...start := time.Now()labels := prometheus.Labels{"service": serviceName}// call your application logic here... this returns simulated random instrumentation numbersrequestsNumber, bytesNumber, responseTimeNumber := processRequest()// calculate responseTime, you would normally set instrument this on responseTimeelapsed := float64(time.Since(start).Nanoseconds())// instrument requestsPerMinute with random number, this could also be done with a histogramrequestsPerMinute.With(labels).Set(requestsNumber)// instrument bytes per minute with random number, this could also be done with a histogrambytesPerMinute.With(labels).Set(bytesNumber)// instrument response time with random number, you would normally use the elapsed variableresponseTime.With(labels).Set(responseTimeNumber)message := fmt.Sprintf("GroundWork Prometheus Metrics example response for %s in %f ns\n",serviceName, elapsed)_, _ = w.Write([]byte(message))}
Since this is an example server with no real traffic, we will contrive the solution using randomly generated metric values.
Okay, so we have our application instrumented. What’s next?
Obviously we will want to see visualizations and observations of the metrics over time. To do this, you’ll need to install a GroundWork Monitor 8 server and connect your app to it with the Prometheus connector. We will assume you have a GroundWork Monitor 8 server installed and accessible to your application.
Visualizing your metrics in GroundWork Monitor
In order to do these steps, first install the Prometheus connector in a suitable location. See the documentation for this connector to determine exactly where and how you want to run it.
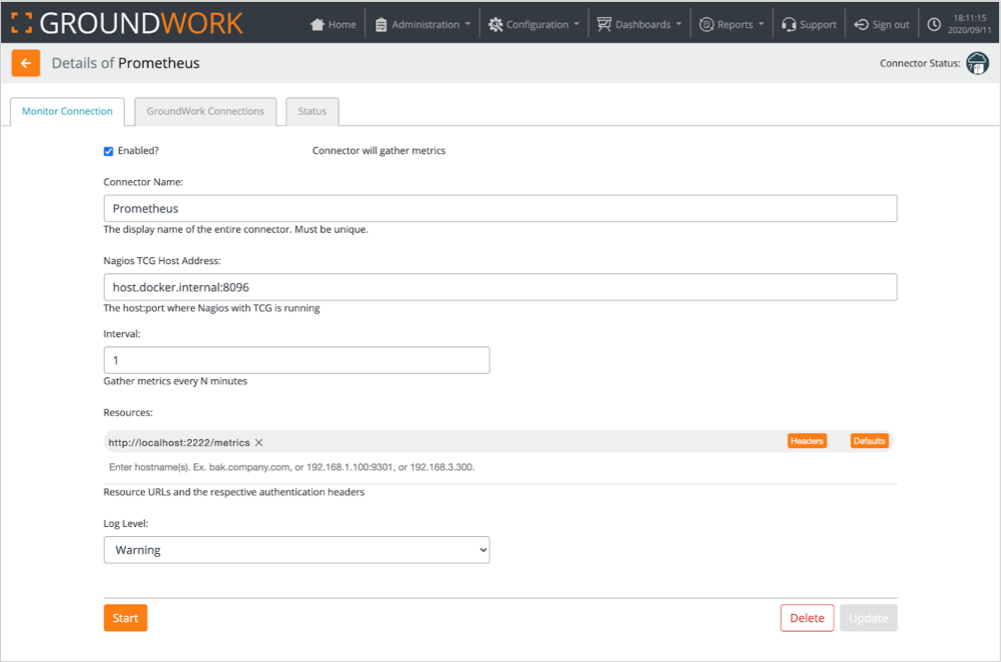
Then, in the GroundWork Monitor user interface, navigate to the menu option Configuration > Connectors and create a new Prometheus connector definition. The TCG Host Address is the address of the host where you installed the Prometheus connector, and the Port number you supply must match the YAML configuration file that comes with your Prometheus connector. The Resources field is a list of one or more Prometheus-instrumented applications. You can also configure Headers here to pass on to your application when connecting.
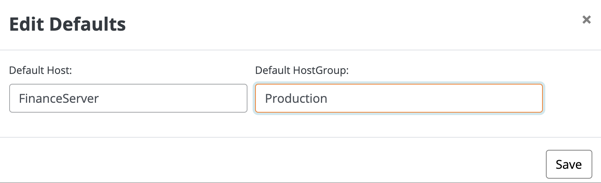
Additionally, you can set defaults for the Host Group and Host per server resource, making categorization of hosts and host groups much easier.
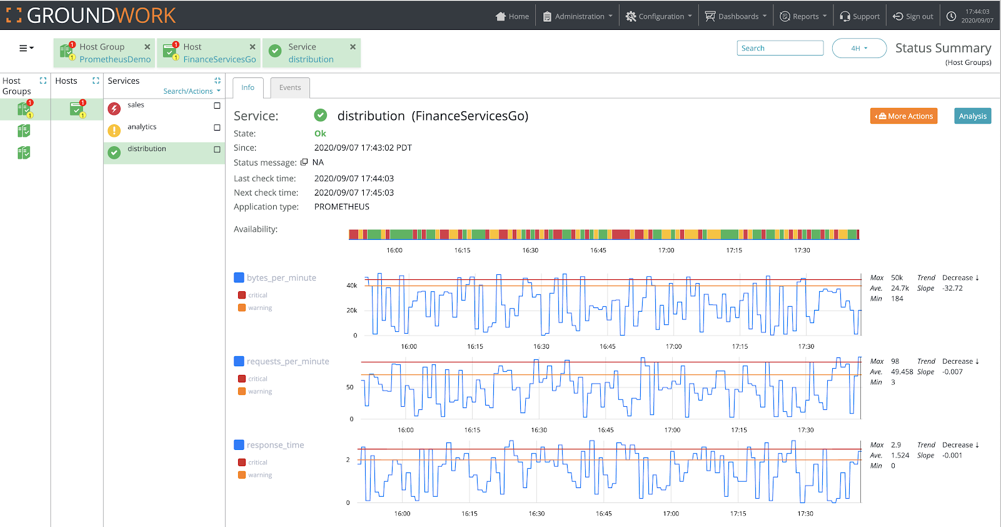
Once the connector is configured, you can see the metrics in the GroundWork server under Dashboards > Status:
This example shows the Host Group View of the Status Summary dashboard. Following the breadcrumb trail, you can see from our instrumented code that the host group name is set to Prometheus Demo, the host is set to FinanceServiceGo, the service is set to the microservice endpoints:
sales
analytics
distribution (currently being displayed)
The three metrics are graphed with line graph samples and warning and critical thresholds over time. The colored bar displays the changing status of this service by showing the color-coded availability history and transitions over the selected time period. Note that this example has more transitions than would be expected in a normal application due to the nature of randomly generated metrics.
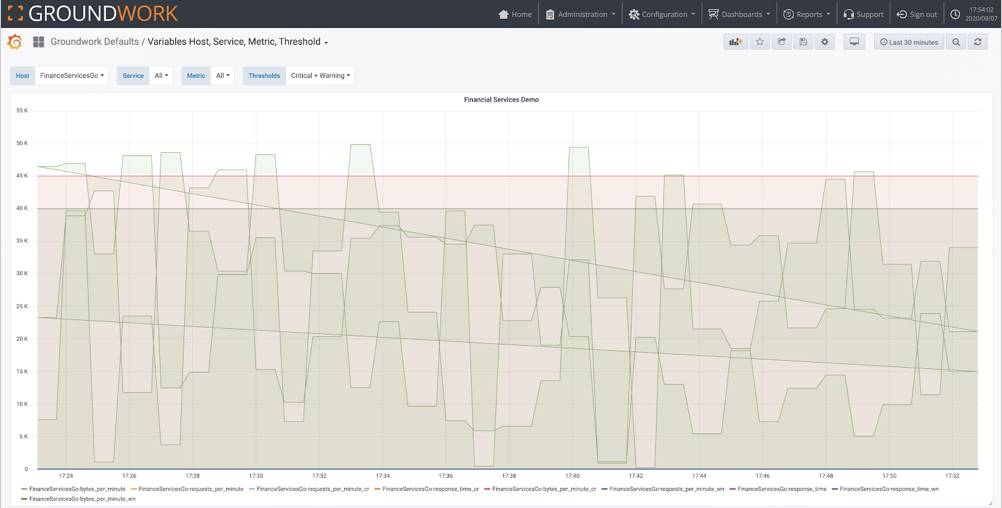
To view these metrics in Grafana, navigate to Dashboards > Graphs:
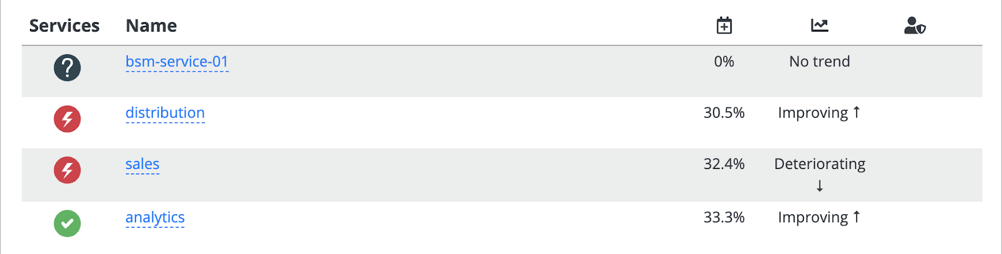
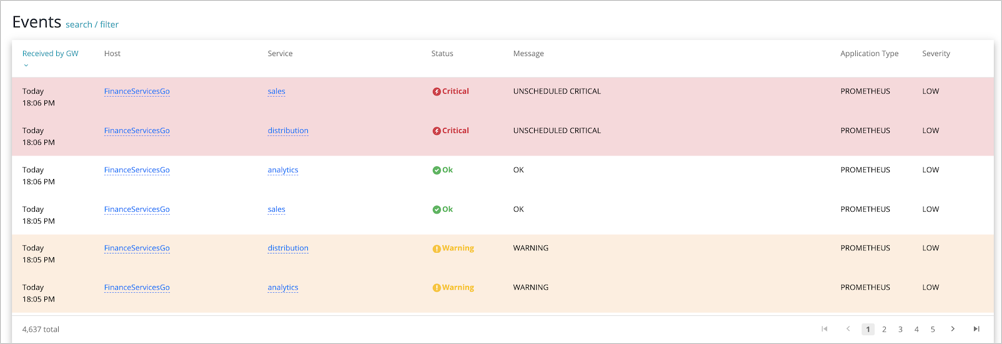
We can also view top problems and events associated with our microservice in the main GroundWork Monitor 8 dashboard:
In Summary
Application Performance Monitoring is becoming the standard way of measuring Cloud-based microservices running in a distributed environment. Many vendors and open source frameworks as well as orchestration systems like Kubernetes or Spring Boot are including open tracing libraries out-of-the-box, providing endpoints supporting the Prometheus Exposition format. With the Prometheus connector, GroundWork Monitor is ready to consume these metrics. In an upcoming blog post, we’ll have a closer look at using histograms to better model time-based distributions of metrics, and graphing multidimensional labels with Grafana.
This video, just 7 minutes long, demonstrates a GroundWork Monitor 8 installation.
For this demo we perform a new install for a standalone type installation on a Linux server with Ubuntu 18.04, and have decided on the hostname ip-10-4-50-199.gwos. This install starts out with some system preparation, proceeds to install Docker, and then prepares and runs the GroundWork Installer.
Before you begin your own installation, please refer to the full installation documentation on the GroundWork Support portal. You will need to follow important instructions for all sections including Pre Install, Install, and Post Install.
Visualizing NOC Operations with GroundWork NOC Boards
September 14, 2020
Single Source of Truth
A monitoring system is a shared tool. It’s useful for teams to operate from the same source of information, since subjective opinions can lead insights astray, especially when troubleshooting systems and network issues. You need a single source of truth.
A monitoring dashboard with drill-down capability is a basic tool for any NOC staff. Often displayed on kiosks or wall-mounted in the Network Operations Center (NOC), dashboards let you know at a glance whether anything needs attention. Read More
This website uses cookies to improve your experience. We'll assume you're ok with this, but you can opt-out if you wish.AcceptRead More
Privacy & Cookies Policy
Privacy Overview
This website uses cookies to improve your experience while you navigate through the website. Out of these, the cookies that are categorized as necessary are stored on your browser as they are essential for the working of basic functionalities of the website. We also use third-party cookies that help us analyze and understand how you use this website. These cookies will be stored in your browser only with your consent. You also have the option to opt-out of these cookies. But opting out of some of these cookies may affect your browsing experience.
Necessary cookies are absolutely essential for the website to function properly. This category only includes cookies that ensures basic functionalities and security features of the website. These cookies do not store any personal information.
Any cookies that may not be particularly necessary for the website to function and is used specifically to collect user personal data via analytics, ads, other embedded contents are termed as non-necessary cookies. It is mandatory to procure user consent prior to running these cookies on your website.