04.20.21

Application Monitoring with Spring Boot, Prometheus, and GroundWork Monitor


In our previous Blog, we introduced how we use Prometheus and the GroundWork Application Performance Monitoring (APM) connector to instrument a GoLang program to send metrics to GroundWork Monitor Enterprise. In this article, we continue with more Prometheus examples, but this time we demonstrate how to instrument a Java application with Spring Boot for easy monitoring. With just a few annotations, your Spring Boot application will generate metrics in the Prometheus Exposition format, and we will then show how easy it is to send those Spring Boot metrics to Groundwork Monitor.

Read More

01.12.21

Looking Inside TLS Certificates

The Difficulty of Dealing with Certs

In the last decade, it has become increasingly important to secure websites and applications using HTTPS instead of HTTP. A GroundWork Monitor installation is no exception, so in GroundWork 8, using HTTPS to access the system is the default setup, and you can add TLS certificates to it that you generate or purchase. See Adding Certificates to HTTPS for more information on doing so. TLS (Transport Layer Security) is the successor to the now-obsolete SSL (Secure Sockets Layer), and TLS certificates support the companion protocol that uses modern cryptography to ensure your HTTPS data on the wire cannot be usefully seen by or altered by third parties.

When dealing with certificates, there are many technical questions about how to efficiently and effectively manage the security setup on a web application. While GroundWork does offer several ways to manage certs and system naming, it’s important at the start to make sure you have the right certificates to begin with. To that end, this post describes a small tool we have developed to assist in this process. Future blog posts and documentation pages will cover additional aspects of the security setup on GroundWork systems.

Read More

10.20.20

Application Monitoring with the Prometheus Client and GroundWork Monitor

Prometheus

Prometheus is a popular open-source systems monitoring and alerting project. The project is a member of the Cloud Native Computing Foundation, joining in 2016 as the second hosted project, after Kubernetes. In this blog, we will demonstrate how to implement Application Performance Monitoring (APM) using the Prometheus GoLang client libraries API and de-facto standard data transport model to feed monitoring metrics into the GroundWork Monitor 8 server. Since we are doing application performance monitoring, this article will have coding examples.

Prometheus has become a very popular instrumenting library for measuring application performance in microservices, especially in Cloud Native applications. Typical measurements in microservices are instrumented on application end points, measuring request count and response time metrics. 

Before we get started writing code, let’s introduce the Prometheus metrics basics.
Read More

06.04.20

The Value of Correlation

Why Correlation?

Data that is static or that behaves the same way day-to-day isn’t indicating aberrant behavior. Looking at the correlation of data from today with data from yesterday can tell you if today is different in some way: positive correlation means today is related to yesterday, particularly if deviation is high. Negative correlation with high variability means that today isn’t like yesterday at all. 

Is something going wrong?

One of the problems you have when looking at operational data is that frequently, it’s not really obvious when something is going wrong. If you are within normal parameters, i.e.,  simple thresholds haven’t been crossed, then what can you tell about how a system is performing today? Read More

04.29.20

The Benefits of Running GroundWork Monitor in Containers

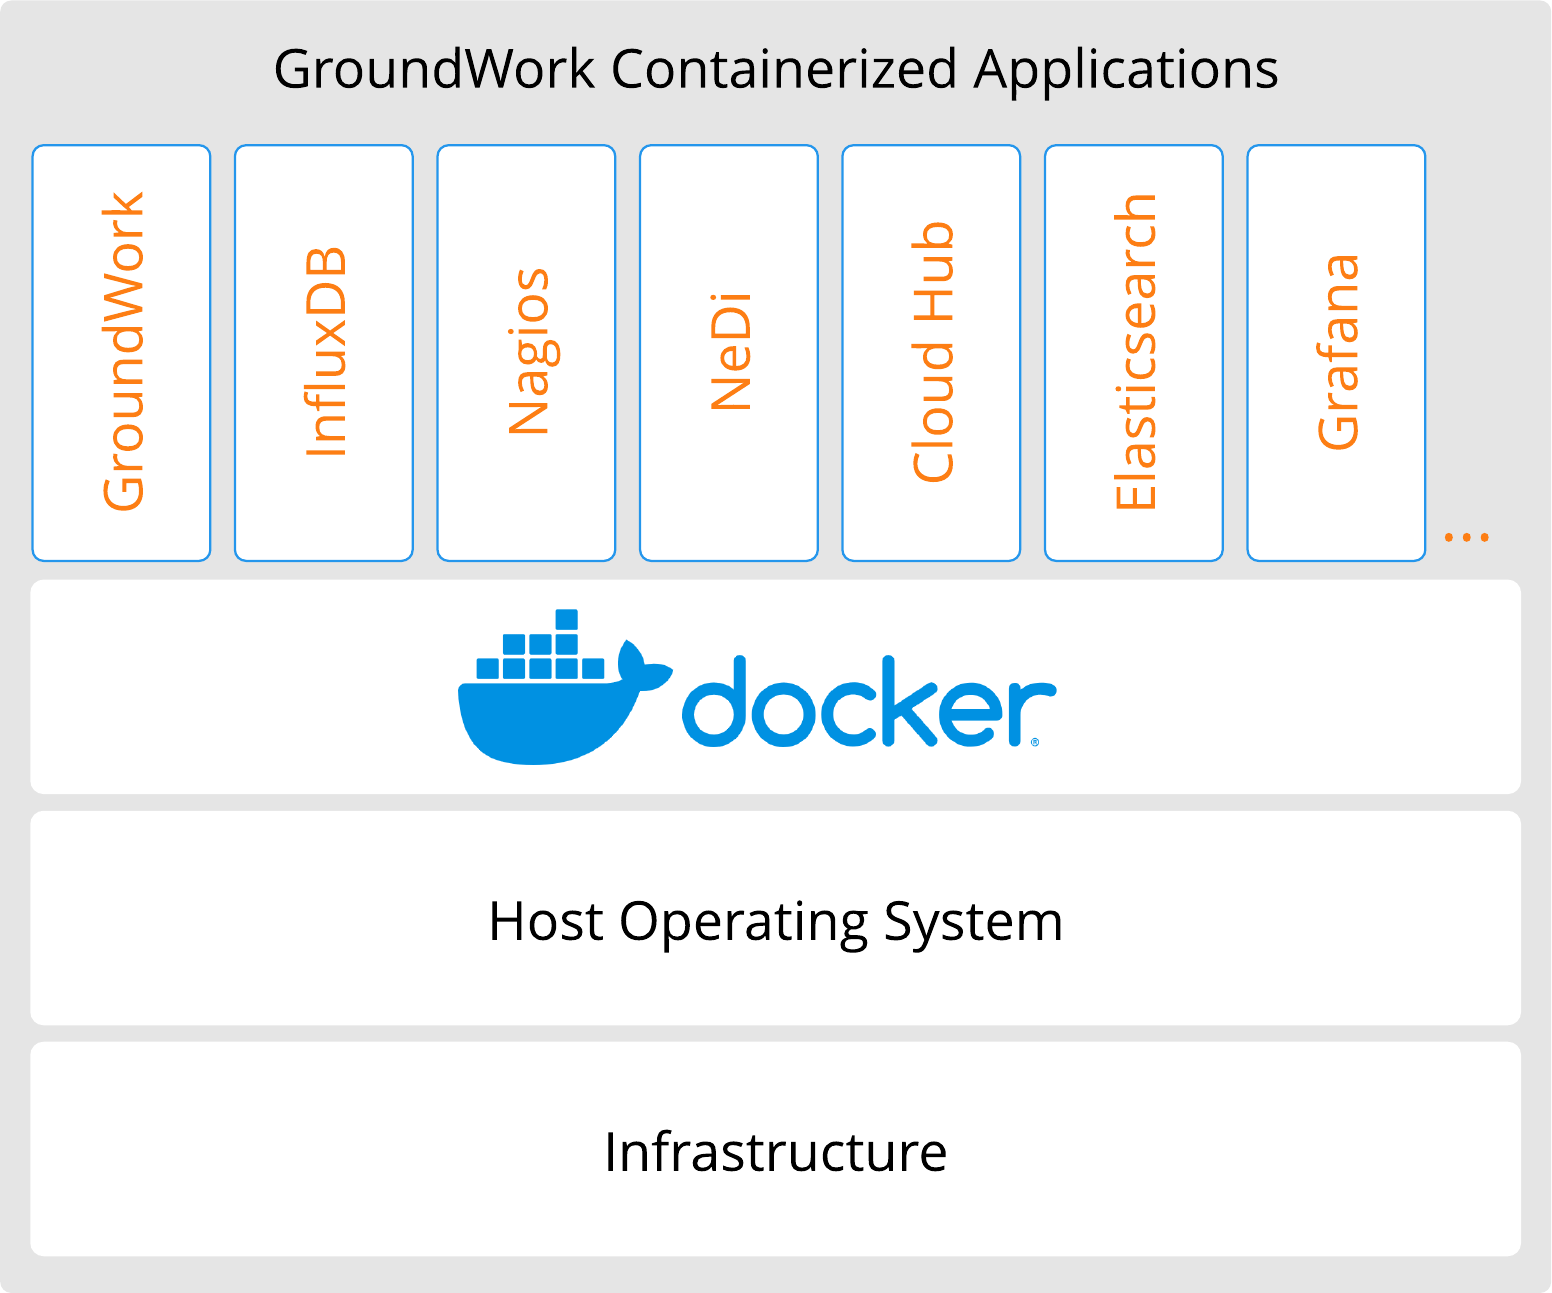
If you have been watching our announcements, you know we have recently released a major new version of GroundWork Monitor Enterprise, version 8. As I write this, that’s actually 8.0.1, which is a little more than the first release. The thing about version 8 though, is that it’s containerized. That’s right, all of the many processes that GroundWork uses to monitor, alert, log, and report on your infrastructure are all running in Docker containers.

Read More

04.17.20

Remote Worker Monitoring with GroundWork Monitor

GroundWork White Paper
by Thomas Stocking

White Paper: Remote Worker Monitoring with GroundWork Monitor

This white paper describes how GroundWork Monitor can help you keep track of resources to support remote worker styles.

Highlights

  • What do you need to access; online only, remote desktop, remote administration?
  • What to monitor, and how
  • Network policy monitoring
04.07.20

How Unified Monitoring Can Help Make Your IT Life Easier!

Unified Monitoring provides real-time understanding of what is happening, every time and everywhere on the network, and everything connected to it. With Unified Monitoring, engineers are more able to support proactive identification of root causes and deploy the actions and resources needed to maintain the health and integrity of all connected IT assets.

As IT infrastructures rapidly evolve in scale and complexity, implementing an integrated and automated platform that monitors the entire IT infrastructure is a proven strategy for reducing service outages, increasing end-user and IT productivity, optimizing capital investment, and maintaining industry compliance—making IT easier than ever before.

To ensure the reliability that businesses expect, IT teams need unified visibility and actionable insight for diagnosing performance issues across the entire IT environment—both physical and virtual, both on-premises and in the cloud.

Read More

08.31.18

Why Open Source Is Mainstream

This is a short piece highlighting how open source and enhanced open source software like GroundWork and others (we can use big examples like Atlassian and Cloudera) are now taken as mainstream components for many company toolsets.

There is a concept in selling products that are “sticky,” or that are not easily or cost-effectively changed out. Product categories like monitoring tend to be sticky, in that there is a significant investment in planning and implementation, in technology such as client-side agents to deploy, and significant license cost. All of these make switching to a competing product less likely. Read More

08.30.16

Change Control in Root Cause Analysis

It’s hard to believe August—and summer—is coming to an end. It’s time to start gearing up for fall, which tends to be a busier time of year for most of us. With that in mind, maybe it’s time to take advantage of GroundWork’s training opportunities to enhance your skill set and get the most out of GroundWork Monitor. This month, we also have a write up about our recent webinar on root cause analysis.

Read More

02.10.16

Monitoring NetApp Devices in GroundWork

NetApp devices are a great way to add network attached storage in a flexible, dynamic way to IT infrastructures. Getting storage handled in a reliable and repeatable way is especially important when dealing with virtualized systems like Openstack and VMware, and in fact NFS mounts from NetApps are often used in OpenStack deployments.

Read More