Application Monitoring with Spring Boot, Prometheus, and GroundWork Monitor
April 20, 2021
In our previous Blog, we introduced how we use Prometheus and the GroundWork Application Performance Monitoring (APM) connector to instrument a GoLang program to send metrics to GroundWork Monitor Enterprise. In this article, we continue with more Prometheus examples, but this time we demonstrate how to instrument a Java application with Spring Boot for easy monitoring. With just a few annotations, your Spring Boot application will generate metrics in the Prometheus Exposition format, and we will then show how easy it is to send those Spring Boot metrics to Groundwork Monitor.
Spring Boot, the de facto standard for Java microservices, has several metrics frameworks already built in. With a couple of tweaks, it easily supports the Prometheus Exposition format, which can be polled by the APM connector in GroundWork Monitor.
Since we are doing Application Performance Monitoring, some coding chops are required to follow the details in this blog. In particular, some experience with Java and the Spring Framework is required to actually build the examples we show in this article, but we will explain what we are doing and why, so even novices can see what’s involved.
Before we get started writing code, you may want to refresh your memory on the fundamentals of the Prometheus Model.
Spring Boot Initializr
To get started, we generated a Maven project using the online Spring Boot Initializr service: https://start.spring.io/:
Spring boot doesn’t support the Prometheus Exposition format by default, so we added the following dependencies to our Spring Boot project to enable it:
Spring Web
Spring Boot Actuator
Prometheus
At the time of this writing, the latest version of Spring Boot was 2.5.0-M3, which is required to get the Spring Boot Actuator dependencies that support Prometheus. That’s really all that’s needed for dependencies.
Building the Coding Examples
In our coding examples, we will stay consistent with the prior blog and extend it a bit. To start with, we instrument and monitor:
One microservice
Three REST endpoints
/metrics
/actuator/prometheus
/simple
One GroundWork host (FinanceServices) and three GroundWork services:
analytics
distribution
sales
Three metrics per GroundWork service
bytes_per_minute
requests_per_minute
response_time (averaged over one minute)
The connector and coding examples for doing this are available for cloning in our public GitHub repository:
To checkout the entire source code to our open source connector framework, go here:
git clone https://github.com/gwos/tcg.git
To run the example Prometheus instrumented server:
$ cd examples/prometheus/pull/java$ mvn install$ mvn spring-boot:run
And then to run the Prometheus connector:
$ cd connectors/prometheus-connector$ go build$ ./prometheus-connector
Spring Boot Actuator Metrics
Now we will get to the extensions. Spring Boot Actuator provides runtime, production ready metrics and system information as RESTful endpoints including:
Health
Caches
Configuration and Environment
App Server Statistics Like Sessions (Tomcat)
Thread Dump
Heap Dump
Garbage Collection
HTTP Requests per Endpoint
Logging Statistics
And many more…
Enabling these endpoints requires no coding. The endpoint we are interested in is the Prometheus endpoint, which contains a full set of application metrics in Prometheus Exposition format. Enabling the Actuator Prometheus metrics is easy. In your application.properties file, simply add:
Then run the application and point your browser to the endpoint, for example:
http://localhost:8080/actuator/prometheus
Visiting that URL in the browser, you will see metrics in Prometheus Exposition line-based format. This format has been recently standardized under the OpenMetrics open source project. GroundWork Monitor supports the OpenMetrics standard in the APM connector.
Let’s look at some samples that are served by the /actuator/prometheus end point. We have two metrics named:
# HELP http_server_requests_seconds# TYPE http_server_requests_seconds summaryhttp_server_requests_seconds_count{exception="None",method="GET",outcome="SUCCESS",status="200",uri="/metrics",} 12.0http_server_requests_seconds_sum{exception="None",method="GET",outcome="SUCCESS",status="200",uri="/metrics",} 0.080140906http_server_requests_seconds_count{exception="None",method="GET",outcome="SUCCESS",status="200",uri="/actuator/prometheus",} 1.0http_server_requests_seconds_sum{exception="None",method="GET",outcome="SUCCESS",status="200",uri="/actuator/prometheus",} 0.019978042http_server_requests_seconds_count{exception="None",method="GET",outcome="SUCCESS",status="200",uri="/simple",} 4.0http_server_requests_seconds_sum{exception="None",method="GET",outcome="SUCCESS",status="200",uri="/simple",} 0.028701704
The count and sum metrics are repeated for each endpoint (/metrics, /actuator/prometheus, and /simple). Each label (in between the brackets {}) represents a dimension on the metric, which can be used downstream by monitoring systems and time series databases to categorize the metric. The actual sampled value of the metric is the last item on the line. See our previous article on Prometheus for a full description of the Prometheus line format.
Here are some samples of the metrics you can monitor with Spring Boot Actuator. The list below is not complete by any means, but it should give you an idea of what’s possible:
Tomcat sessions:
# HELP tomcat_sessions_active_max_sessions # TYPE tomcat_sessions_active_max_sessions gaugetomcat_sessions_active_max_sessions 0.0# HELP tomcat_sessions_created_sessions_total # TYPE tomcat_sessions_created_sessions_total countertomcat_sessions_created_sessions_total 0.0# HELP tomcat_sessions_alive_max_seconds # TYPE tomcat_sessions_alive_max_seconds gaugetomcat_sessions_alive_max_seconds 0.0# HELP process_start_time_seconds Start time of the process since unix epoch.# TYPE process_start_time_seconds gaugeprocess_start_time_seconds 1.617142505672E9
JVM threads and memory:
# HELP jvm_threads_peak_threads The peak live thread count since the Java virtual machine started or peak was reset# TYPE jvm_threads_peak_threads gaugejvm_threads_peak_threads 22.0# HELP jvm_memory_used_bytes The amount of used memory# TYPE jvm_memory_used_bytes gaugejvm_memory_used_bytes{area="heap",id="G1 Survivor Space",} 5507392.0jvm_memory_used_bytes{area="heap",id="G1 Old Gen",} 1.188864E7jvm_memory_used_bytes{area="nonheap",id="Metaspace",} 3.0493616E7jvm_memory_used_bytes{area="nonheap",id="CodeHeap 'non-nmethods'",} 1252352.0jvm_memory_used_bytes{area="heap",id="G1 Eden Space",} 1.2582912E7
Class loader and process uptime:
HELP jvm_classes_loaded_classes The number of classes that are currently loaded in the Java virtual machine# TYPE jvm_classes_loaded_classes gaugejvm_classes_loaded_classes 7081.0# HELP jvm_threads_daemon_threads The current number of live daemon threads# TYPE jvm_threads_daemon_threads gaugejvm_threads_daemon_threads 18.0# HELP jvm_gc_max_data_size_bytes Max size of long-lived heap memory pool# TYPE jvm_gc_max_data_size_bytes gaugejvm_gc_max_data_size_bytes 8.589934592E9# HELP process_uptime_seconds The uptime of the Java virtual machine# TYPE process_uptime_seconds gaugeprocess_uptime_seconds 79146.05
Threads:
# HELP jvm_threads_states_threads The current number of threads having NEW state# TYPE jvm_threads_states_threads gaugejvm_threads_states_threads{state="runnable",} 8.0jvm_threads_states_threads{state="blocked",} 0.0jvm_threads_states_threads{state="waiting",} 11.0jvm_threads_states_threads{state="timed-waiting",} 3.0jvm_threads_states_threads{state="new",} 0.0jvm_threads_states_threads{state="terminated",} 0.0
Next we will configure GroundWork Monitor to pull Prometheus metrics from our application.
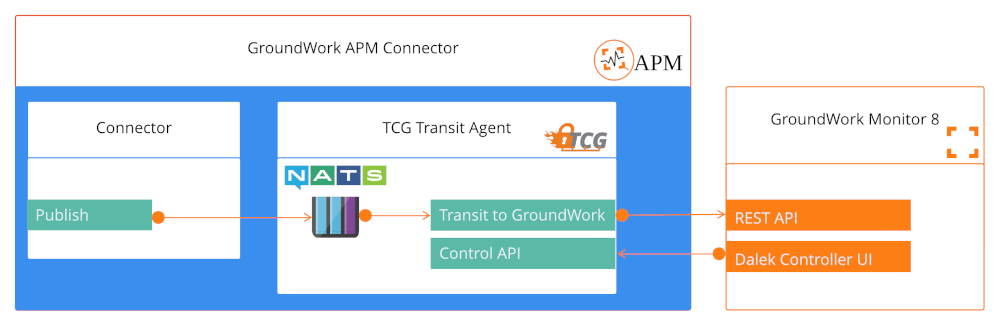
The GroundWork APM Connector
The APM Connector can be started by enabling it in docker-compose-override.yml:
Once it’s running, login to GroundWork Monitor, navigate to the Configuration > Connectors menu option and add a new Prometheus connector definition.
The TCG host address is the address of the host where you installed the Prometheus connector (that is, the container you just started). The Resources field is a list of one or more Prometheus-instrumented applications. The example below shows how we use this list to point to the three endpoints we set up.
Note: The hostname in this example is specific to docker running on Mac OSX. For Linux, the hostname will be 172.17.0.1 if you are running the application on the GroundWork Monitor host itself. You could also use the fully-qualified domain name of the system running the application.
Additionally, you can set defaults for the Host Group and Host per server resource, making categorization of hosts into host groups much easier.
You can also configure headers here to pass on to your application when connecting.
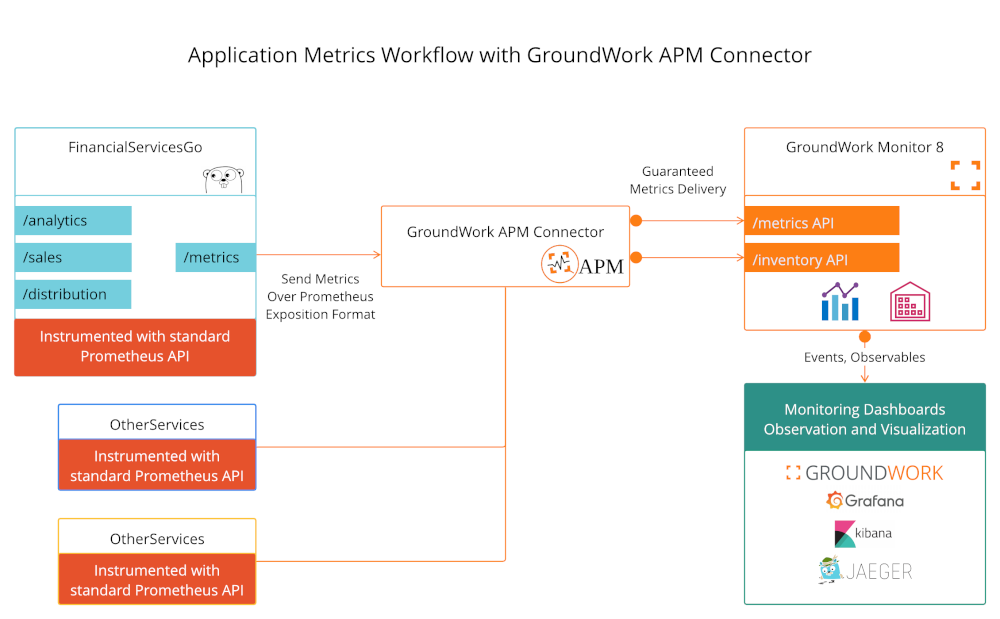
GroundWork Architecture
GroundWork 8 introduces a connector architecture for gathering metrics from a diverse set of sources. The APM connector adds to the list of supported connectors including Kubernetes, Docker, Elastic, OpenStack, VMware and more. Additionally, we have Cloud connectors for AWS, Google Cloud and Microsoft Azure. The APM connector runs between your servers being monitored and GroundWork Monitor. In the diagram below, the Prometheus connector periodically pulls metrics from our example FinancialService application. Metrics and Inventory are queued in the connector, and won’t be removed from the queue until they are delivered to GroundWork Monitor. Once they are received by GroundWork Monitor, they are immediately made available to GroundWord Monitoring Dashboards, as well as other visualization applications like Grafana, Kibana, and Jaeger. All of these visualization UIs are packaged with GroundWork Monitor Enterprise out-of-the-box.
Instrumenting your Application Metrics
Great! We’ve seen how to enable Spring Boot Actuator metrics. What next? What about custom metrics? Ok, we will generate some metrics of our own by instrumenting our code further. Let’s dive into one of the examples from our open source Github repository. We will be looking at the “pull” examples found in examples/prometheus/pull/java/*.java. To follow along, open up DemoController.java in your favorite editor.
We start with a simple example (using the endpoint /simple). This is not a recommended coding technique, but it does show the simplicity of the Prometheus format. This example requires Java 15 to make use of Text Blocks:
private String SIMPLE_PROMETHEUS_METRICS =""" # HELP simple_calculated using calculated monitor status # TYPE simple_calculated counter simple_calculated{service="simple-service-1",warning="80",critical="90",resource="AppGenerated",group="SpringBoot"} %d # HELP simple_metric and passing in the status code # TYPE simple_metric counter simple_metric{service="simple-service-1",resource="AppGenerated",status="%s"} %d """;
We just take this string, format it, and return metrics.
@RequestMapping("/simple")public String prometheusSimpleEndPoint(HttpServletResponse response) {Random random = new Random(); response.setStatus(random.nextInt(2) > 0 ? 220 : 200);return String.format(SIMPLE_PROMETHEUS_METRICS, random.nextInt(100), MONITOR_STATUS.get(random.nextInt(3)), random.nextInt(100));}
And voila, we have a simple metrics example end point (using random numbers).
Next, open up PrometheusController.java. Add your new metrics like this:
CounterMetricFamily requestsPerMinute = new CounterMetricFamily("requests_per_minute","Finance Services http requests per minute.",labels);GaugeMetricFamily bytesPerMinute = new GaugeMetricFamily("bytes_per_minute","Finance Services bytes transferred over http per minute.",labels);GaugeMetricFamily responseTime = new GaugeMetricFamily("response_time","Finance Services http response time average over 1 minute.",labels);
Above we have created three metrics. The first example is a counter, and the second and third examples are gauges. This is important when we get to persisting and graphing these metrics in GroundWork Monitor.
Labels can be static or dynamic. All GroundWork metrics must be attached, with a label, to a Service. We use dynamic labels, since we want to change labels based on runtime information.
We need to add labels for Resource(Host) and Group. These labels are used for classification in GroundWork. If you don’t want to set them in code, you can set the resource and group labels in the connector provisioning UI under Defaults. See above.
GroundWork Monitor works best with warning and critical threshold values per metric. Thresholds are used to determine status of a host or service. Additionally, thresholds, when supplied, are stored in the time series database and displayed by graphing tools like Grafana, so it makes sense to include them in the program. If you need to you can of course override them in the UI.
for (String service : services) {// Counter multi metric building examplerequestsPerMinute.addMetric(new ArrayList<String>() {{ add(service); // service nameadd("70"); // warning thresholdadd("90"); // critical thresholdadd(defaultResource); // resource name (host)add(defaultGroup); // group name}}, (int) (1 + Math.random() * 100)); // value
Our example has three services, each of which has its own set of metrics:
List<String> services = new ArrayList<String>() {{ add("analytics"); add("distribution"); add("sales");}};
The Prometheus library then formats our collection of metrics to the Prometheus Exposition format with the TextFormat utility class:
DecimalFormat df = new DecimalFormat("#.#");List<Collector.MetricFamilySamples> mfs = new ArrayList<>();….mfs.add(requestsPerMinute);mfs.add(bytesPerMinute);mfs.add(responseTime);TextFormat.write004(writer, Collections.enumeration(mfs));return writer.toString();
Since this is an example server with no real traffic, we will contrive the solution using randomly generated metric values.
OK, so we have our application instrumented, and you configured the APM connector in GroundWork Monitor to point to it, so we can take a look at some visualizations.
Visualizing Your Metrics in GroundWork Monitor
Once the Prometheus connector is configured, you can immediately see metrics in the GroundWork Monitor under Dashboards > Status:
This example shows the Host Group view of the Status dashboard. Following the breadcrumb trail, you can see from our instrumented code that the host group name is set to SpringBoot, the host is set to Actuator, the services are the Actuator metrics. The AppGenerated host is from the /simple endpoint.
This example shows the HostGroup View of the Status Summary dashboard. Following the breadcrumb trail again, you can see that the host group name is set to PrometheusDemo, the host is set to FinanceServiceJavaa, the service is set to the microservice endpoints:
sales
analytics
distribution
The metrics are graphed with line graph samples and warning and critical thresholds over time. The colored bar displays the changing status of this service by showing the color-coded availability history and transitions over the selected time period. Note that this example has more transitions than would be expected in a normal application due to the nature of randomly generated metrics.
To view these metrics in Grafana, navigate to the Dashboards->Graphs menu, where you can create pretty much any graphs you like. Here’s a quick example:
We can also view top problems and events associated with our microservice in the main GroundWork Monitor 8 dashboard:
You can get alerts when your microservice has issues, of course. See GroundWork documentation for detailed instructions and examples.
In Summary
Application Performance Monitoring is becoming the standard way of measuring Cloud-based microservices running in a distributed environment. Many vendors and open source frameworks as well as orchestration systems like Kubernetes or Spring Boot are including open tracing libraries out of the box, providing endpoints supporting the Prometheus Exposition format. With the Prometheus connector, GroundWork Monitor is ready to consume, process, persist and present these metrics.
See our support portal GroundWork Support at www.support8.gwos.com.
Thanks for reading our Blog.
Other Posts...
Business Service Monitoring (BSM) with GroundWork Monitor
March 18, 2021
How to use BSM to Prioritize Important Issues
We all want our monitoring systems to alert us when things go wrong. While it’s important to get alerts in the event of a failure or latency problem on something specific such as a SQL database, it’s actually just as important to not receive alerts from too many specific sources in the same alerting channel. If our monitoring system starts to fatigue us, we will ignore alerts until the phone calls and Emails from end users start letting us know a service is impaired or unavailable. Our monitoring solution should notify us both about specific failures in general and major issues, so we can differentiate and prioritize.
A single event, such as max processes in use on a database may not in itself be a problem that needs to be addressed on an emergency basis. A combination of events, though, such as a high value of max processes, a large amount of network discards, and slow response time for an http request can indicate a more general problem that is currently impacting the end users. We can easily monitor all of these conditions individually.
Using Let’s Encrypt Free Certs with your Linux Servers
February 16, 2021
Part 2 of our Blog series on certificates focuses on a practical matter: using the free Let’s Encrypt certificates to secure servers that may not be publicly available, but still need better security than self-signed certs can give you.
As we explained in our last blog on this subject, to use HTTPS encryption with certificates, you can choose from a number of options:
self-signed certificate
a cert from a private Certificate Authority (CA), in this case, you or your company run the CA, not a trivial task!
a certificate signed by a Root CA you trust
GroundWork supports any of these (or even two at once on the same server). What you choose to use depends on a lot of things, like your tolerance for trust failure reports in your browser from self-signed or private CA certificates. Basically, only root-signed certs are trusted by browsers out-of-the-box, so unless you want to deal with users reporting and complaining about those failures, and explaining how to explicitly trust the certs you use, it’s best to use certs signed by a Root CA.
This website uses cookies to improve your experience. We'll assume you're ok with this, but you can opt-out if you wish.AcceptRead More
Privacy & Cookies Policy
Privacy Overview
This website uses cookies to improve your experience while you navigate through the website. Out of these, the cookies that are categorized as necessary are stored on your browser as they are essential for the working of basic functionalities of the website. We also use third-party cookies that help us analyze and understand how you use this website. These cookies will be stored in your browser only with your consent. You also have the option to opt-out of these cookies. But opting out of some of these cookies may affect your browsing experience.
Necessary cookies are absolutely essential for the website to function properly. This category only includes cookies that ensures basic functionalities and security features of the website. These cookies do not store any personal information.
Any cookies that may not be particularly necessary for the website to function and is used specifically to collect user personal data via analytics, ads, other embedded contents are termed as non-necessary cookies. It is mandatory to procure user consent prior to running these cookies on your website.