Business Service Monitoring (BSM) with GroundWork Monitor
March 18, 2021
How to use BSM to Prioritize Important Issues
We all want our monitoring systems to alert us when things go wrong. While it’s important to get alerts in the event of a failure or latency problem on something specific such as a SQL database, it’s actually just as important to not receive alerts from too many specific sources in the same alerting channel. If our monitoring system starts to fatigue us, we will ignore alerts until the phone calls and Emails from end users start letting us know a service is impaired or unavailable. Our monitoring solution should notify us both about specific failures in general and major issues, so we can differentiate and prioritize.
A single event, such as max processes in use on a database may not in itself be a problem that needs to be addressed on an emergency basis. A combination of events, though, such as a high value of max processes, a large amount of network discards, and slow response time for an http request can indicate a more general problem that is currently impacting the end users. We can easily monitor all of these conditions individually.
So how do we combine them?
Business Service Monitoring (BSM) provides an aggregate view of this type of business availability condition. You can combine the monitoring of things that may potentially cause business impacting failures into a single service check from which you can determine the:
Potential for end user impact
Likely root cause of the problem
This critical information allows you to be proactive, to understand the impact of all those specific alarms, and ideally to begin resolution prior to receiving tickets from end users. It can also allow you to engage the right team(s) to resolve the issue, rather than waiting for individual teams to rule out the components in their area of responsibility.
Data from a BSM service is also exactly the sort of information you might want to publish on a user visible page or dashboard, allowing users to see whether a service is experiencing trouble. This transparency builds trust, and lets them know they don’t need to file a ticket. You already know about it, and they can let you get after it without bothering you.
Also, a BSM dashboard can be a great place for a high-level/management overview of how the business is functioning, with the capability to drilldown into the technical detail if necessary.
User Experience
It is very common to monitor availability of specific services within our IT environments. Think disk space, for example, or the fact a particular process is running. One thing often overlooked though, is user experience. BSM is a great way to determine how the user experience may be impacted.
For an example, we’ll set up a simple case in which a user connects via a VPN to access a web service on an internal server. From the user’s perspective they are logging into a system, or performing some other action on a web page, and they don’t know (or even care) how many components are involved in ensuring the success of those actions.
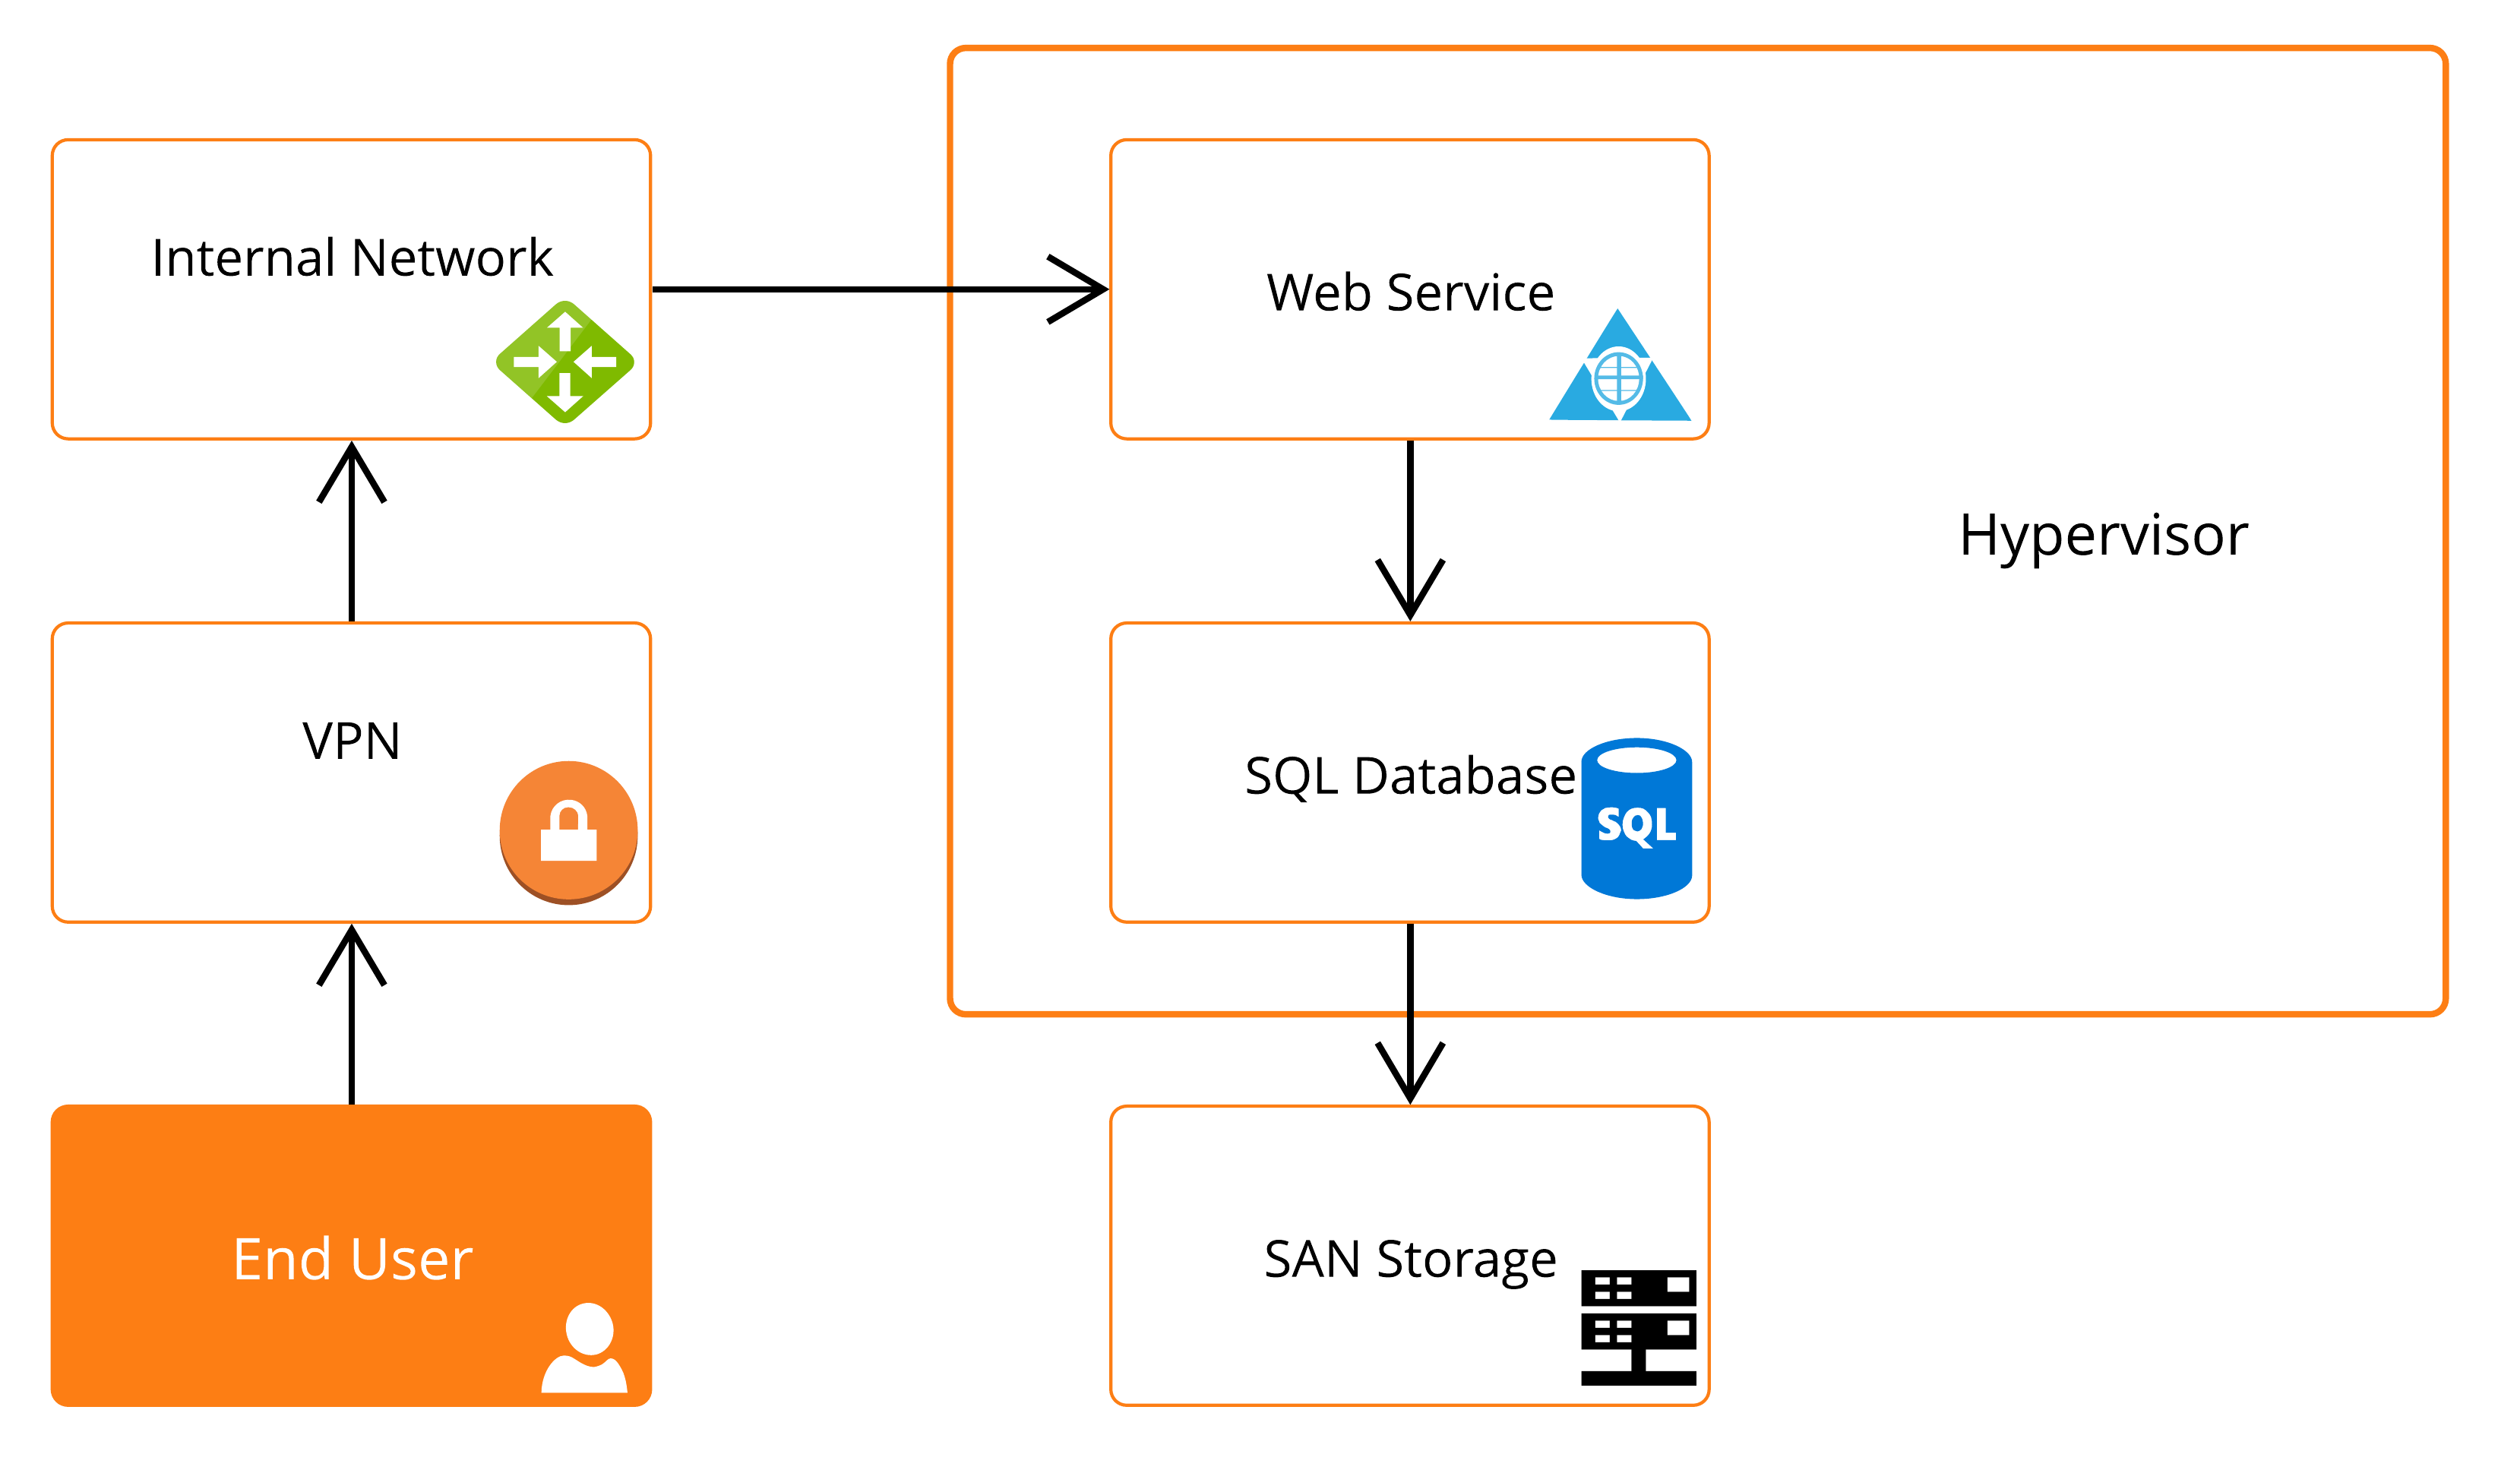
On the back end, however, we know the whole picture. It may look something like this:
A web application running on an NGINX web server needs to query a SQL database to check for validity of the users name and password, and the database requires backend SAN storage in order to be able to provide that data. Add to that the fact that the SQL database and the web server are virtualized with a hypervisor. Of course all of the data that allows these components to work is being transmitted with the help of our network devices. A bit much to model, perhaps, but we’ve established there are a lot of points of failure, and the user performing the action depends on all of them to be performing optimally to ensure a smooth user experience.
When possible, monitoring of services such as response time of a HTTP request should be done from the same network segment the end user is on, so that you receive a response that would be similar to what an actual user would experience. Of course, this is not always possible due to security or other constraints, but it’s good to keep in mind. If you are running the HTTP response check from the web server itself, you are likely excluding things that a real end-user’s HTTP transaction would do, such as traversing different networks and network devices. This is good for isolation of the problem to the network or the system, but can skew the results.
So, deciding what is important to the business and ensuring it is monitored appropriately is the first step to take to ensure a successful BSM implementation.
Implementing BSM
Implementation of BSM is very straightforward. After signing in to GroundWork Monitor with an admin user who also has the BSM_Admin role, navigate to Configuration > BSM and SLAs > BSM to create a new BSM group. Click Manage groups, then Create.
Here, we will need to fill out the following fields:
Display – Enter the Display name of the BSM group. This is visible only in the BSM interface.
Description – Add a description to the BSM group. You might need to explain what it’s for to your coworkers here.
Monitoring – Check the monitoring box if you would like to receive alerts for this BSM group. You usually will do this. If so, you’ll also need to add a few more bits of data:
Host definition – Enter a host to report the BSM service, which can be a new or existing host, the service you define will show up attached to this host in your dashboards
Service definition – Enter the name of the service to be created for this BSM group
Hostgroup – Enter a host group to add the host and service to
Priority – Set the priority to High, Medium, or Low for each group, which enables only groups filtered by priority to be displayed within the View groups tab, usually, you will set this to High priority
Thresholds – Enable and choose how many problems (or what percentage) trigger a Warning or Critical for the BSM group
In this case, we are aggregating critical components and want to get a BSM alert should there be more than one failure, so we will set both Warning and Critical thresholds to 2 problems. The result is that we will receive a critical alert if 2 components are degraded.
Problems – You might not want to count all non-OK states as problem states for your member hosts and services. This is especially true if you use acknowledgements and/or dependencies in your operational processes and configurations. If you click Show States, you can select the specific possible states to include in the rules for counting against thresholds.
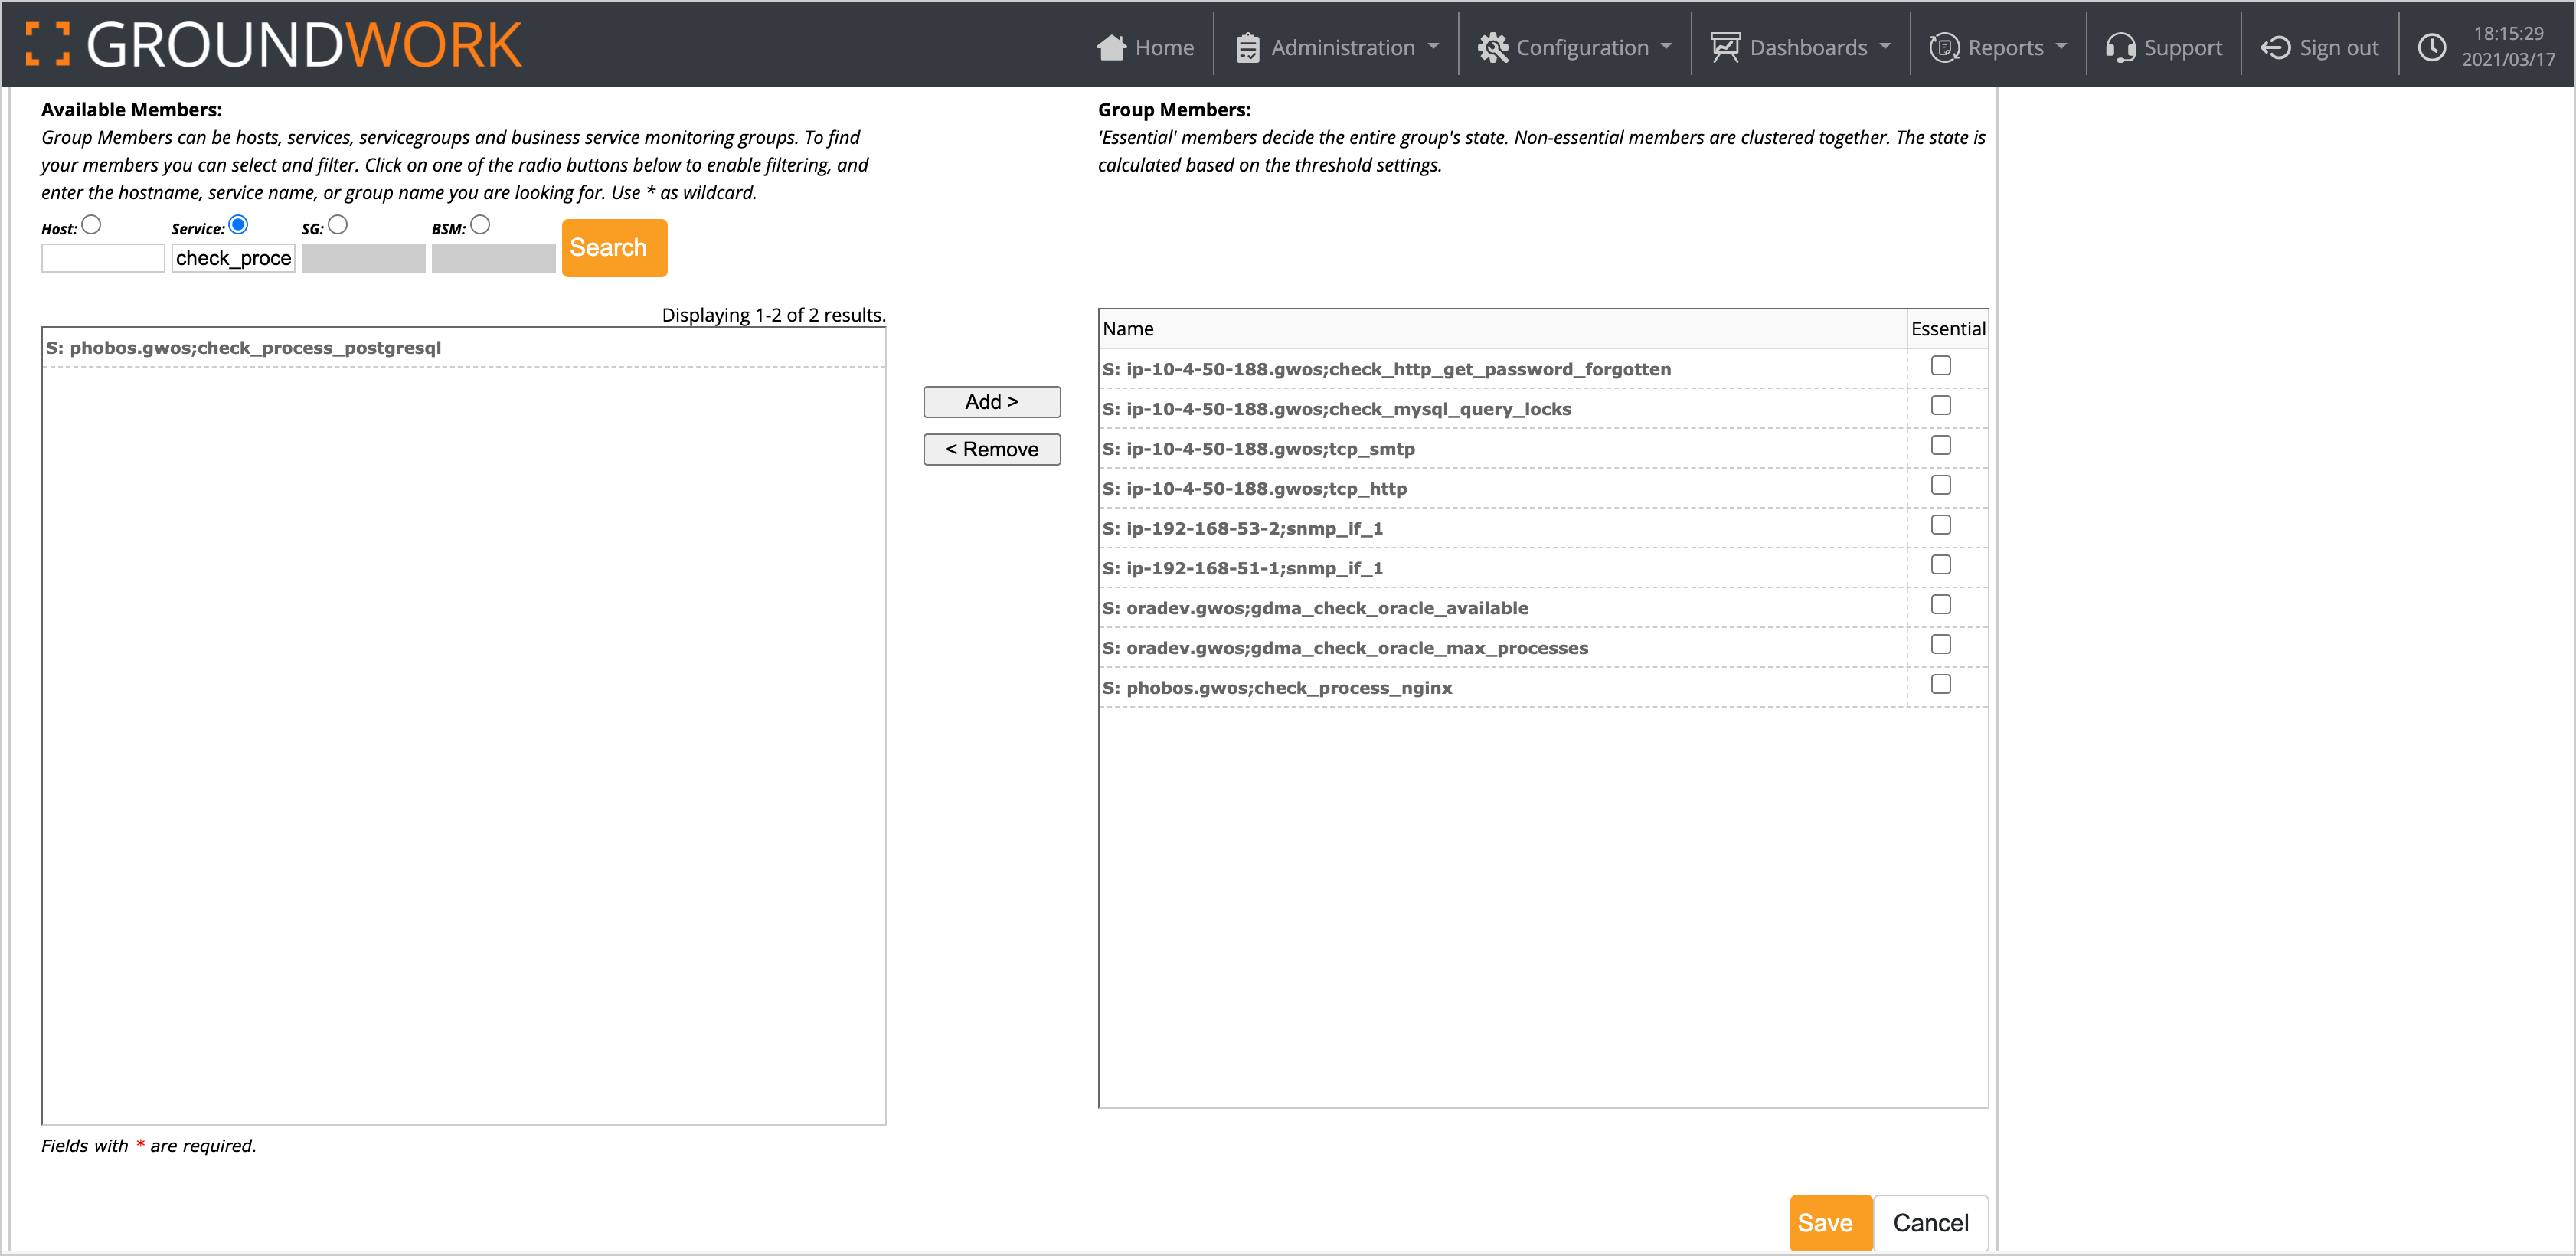
Group Members – Finally, select group members. This is the key step. Usually, you will use service members, though you can also use hosts, or even groups or other BSM services. Click the Service radio button, find the services you would like to group, select them, then click the Add button. You can also Ctrl+Left-Click to select multiple services to add to a group.For example, in the scenario described, we have added every component required to ensure a smooth user experience for web transactions, including a synthetic transaction simulating the user experience (a subject for another blog):
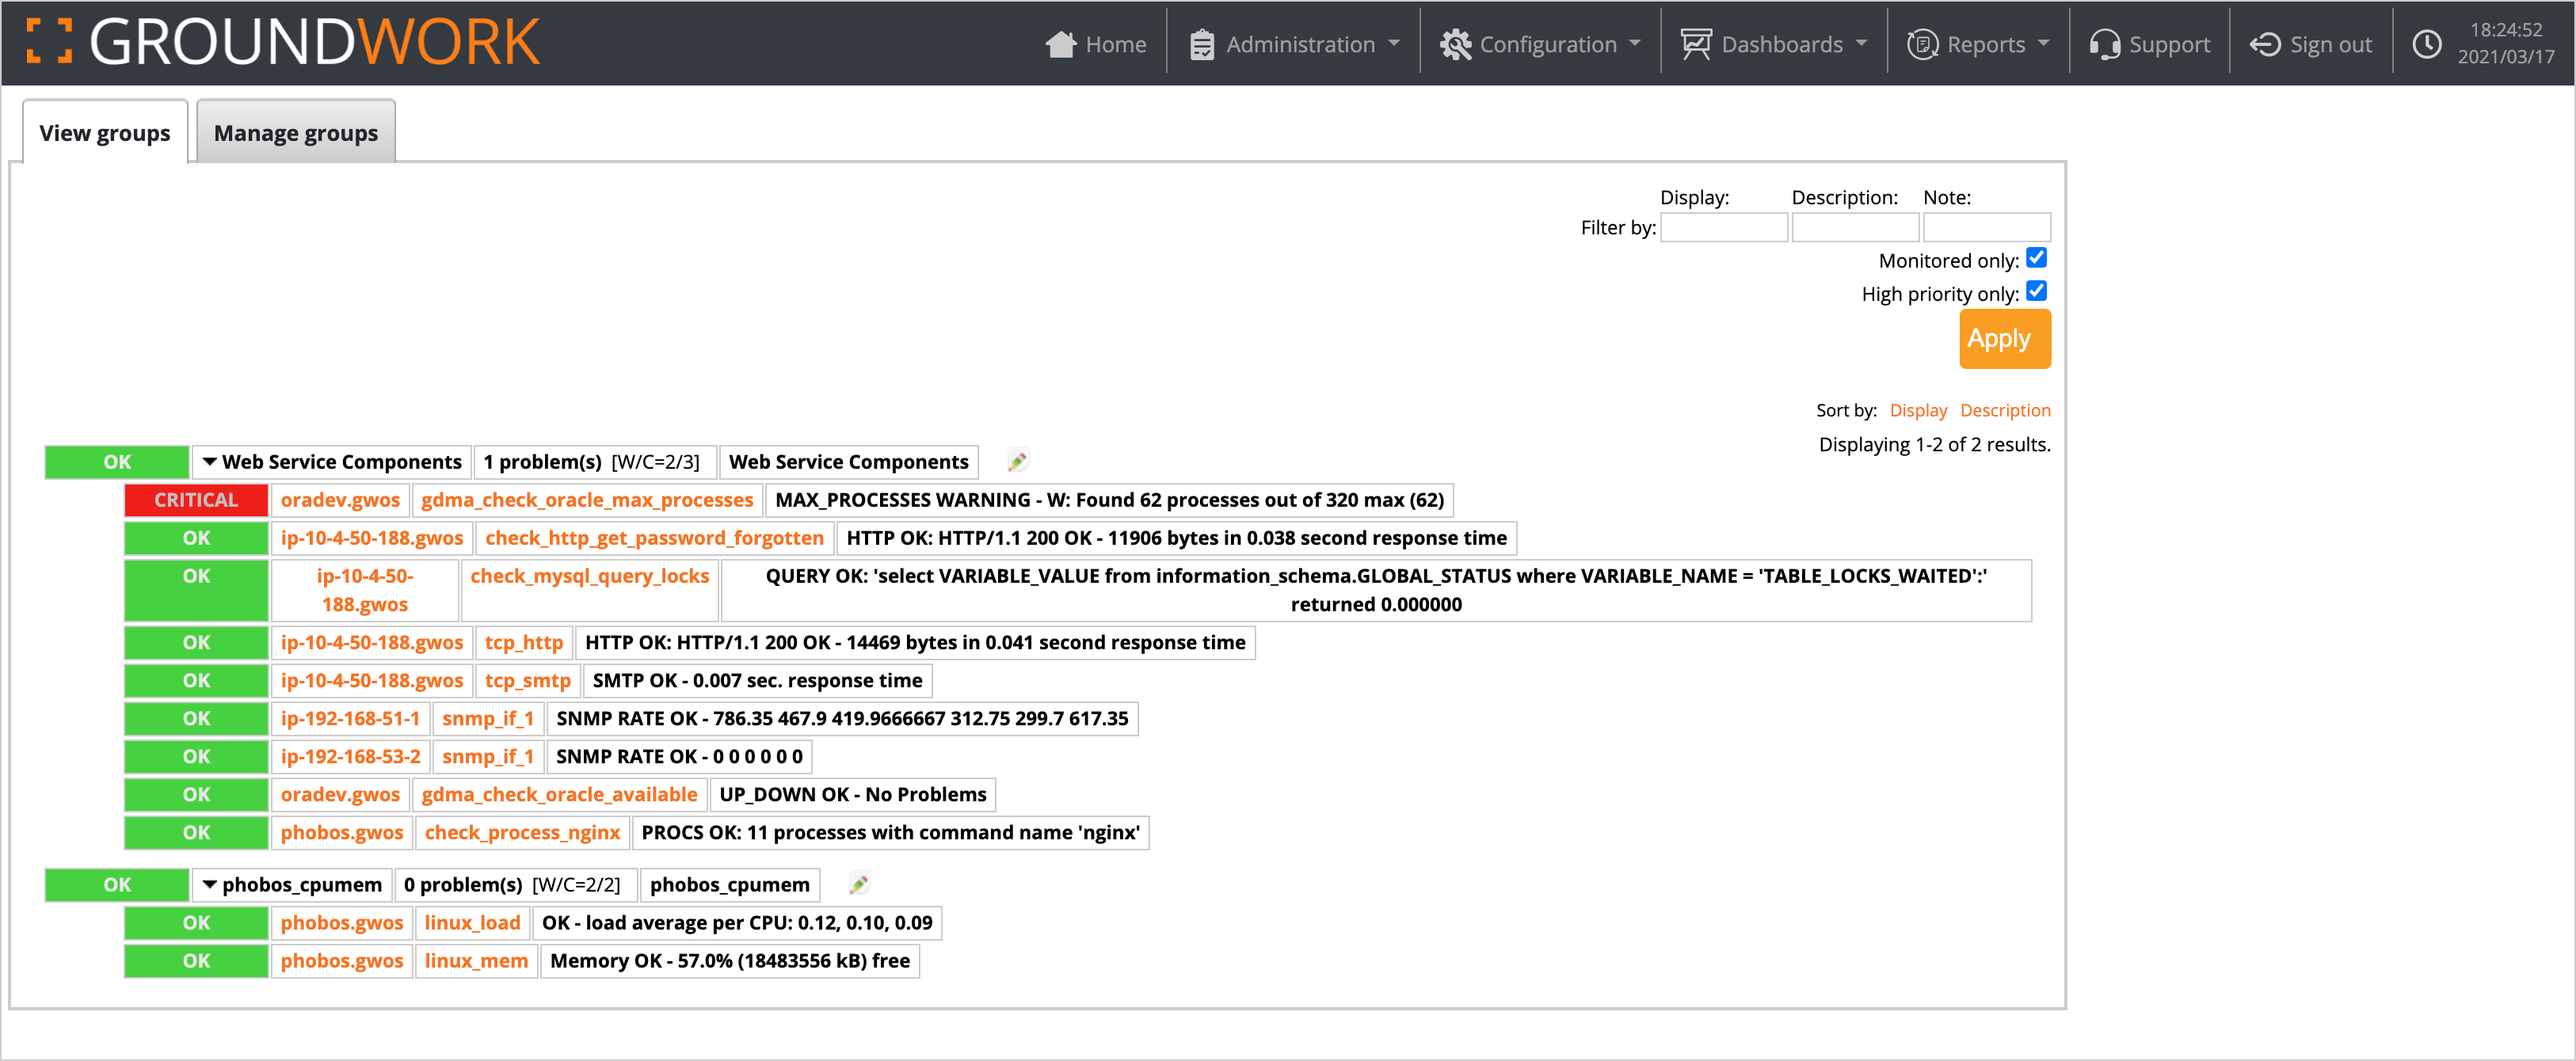
Once you are satisfied with your configuration, click Save. The BSM group will now be displayed in the BSM dashboard:
Notice while we have a critical service check, our BSM group is still in an OK state. This is because of the threshold setting; it will not go into a critical state unless another problem arises. That is what we want out of a BSM service: awareness of, and capability to alert on business critical issues. The single issue reported here can be handled as a day-to-day administration task.
Now that we have the service defined, we’ll start seeing results in the Status dashboard for it under the host we selected.
It’s available to add to SLA dashboards, NOC Boards, and of course notification definitions. We can even expose it to a web address without authentication for inclusion in a public dashboard as a json file using the Publish Status option.
In Summary
BSM is a great way to aggregate business critical components for monitoring and alerting, and for displaying a dashboard of overall business status for public awareness or a management view. Multiple BSM dashboards are supported for various purposes, for instance we have one called phobos_cpumem that alerts us if CPU and memory are both in a degraded state at the same time, which is more important than spikes from either check individually.
Using Let’s Encrypt Free Certs with your Linux Servers
February 16, 2021
Part 2 of our Blog series on certificates focuses on a practical matter: using the free Let’s Encrypt certificates to secure servers that may not be publicly available, but still need better security than self-signed certs can give you.
As we explained in our last blog on this subject, to use HTTPS encryption with certificates, you can choose from a number of options:
self-signed certificate
a cert from a private Certificate Authority (CA), in this case, you or your company run the CA, not a trivial task!
a certificate signed by a Root CA you trust
GroundWork supports any of these (or even two at once on the same server). What you choose to use depends on a lot of things, like your tolerance for trust failure reports in your browser from self-signed or private CA certificates. Basically, only root-signed certs are trusted by browsers out-of-the-box, so unless you want to deal with users reporting and complaining about those failures, and explaining how to explicitly trust the certs you use, it’s best to use certs signed by a Root CA.
Lately, security has become top of mind across infrastructure monitoring customers. This is no surprise considering the widespread reports about supply-chain vulnerabilities and embedded compromises rampant in popular network monitoring software. In light of this, we want to underscore how seriously we have always taken our security processes, and how we cultivate a culture based on a foundation of sound security protocols.
We strive to be good stewards of our customer’s data and take great pains to ensure we are always on the bleeding edge of security best practices. A chain is only as strong as its weakest link, which is why we integrate secure processes into the development and deployment of GroundWork, and immediately respond to feedback and suggestions from customers. In this post we outline 7 ways in which our security policies manifest within the platform and our company culture.
This website uses cookies to improve your experience. We'll assume you're ok with this, but you can opt-out if you wish.AcceptRead More
Privacy & Cookies Policy
Privacy Overview
This website uses cookies to improve your experience while you navigate through the website. Out of these, the cookies that are categorized as necessary are stored on your browser as they are essential for the working of basic functionalities of the website. We also use third-party cookies that help us analyze and understand how you use this website. These cookies will be stored in your browser only with your consent. You also have the option to opt-out of these cookies. But opting out of some of these cookies may affect your browsing experience.
Necessary cookies are absolutely essential for the website to function properly. This category only includes cookies that ensures basic functionalities and security features of the website. These cookies do not store any personal information.
Any cookies that may not be particularly necessary for the website to function and is used specifically to collect user personal data via analytics, ads, other embedded contents are termed as non-necessary cookies. It is mandatory to procure user consent prior to running these cookies on your website.