Docker Container Monitoring with GroundWork Cloud Hub
June 19, 2020
Why Containers?
Container technologies have captivated the computing world. Containers are the cornerstone for cloud computing and microservice architectures. Whether it be Docker™, Docker Compose™, or Kubernetes™, the IT world is embracing this technology with great enthusiasm.
How can you monitor containers? They are different from traditional hosts and servers. For one thing, they are not physical machines; nor are they virtual machines. Containers can be spun up to handle periodic load, and then torn down when no longer needed. With Kubernetes, containers can also be replicated and load balanced in pods across clusters.
Monitoring Containers with the Docker Connector
In this article, we will demonstrate how to monitor containers in Docker with the GroundWork Monitor Docker connector.
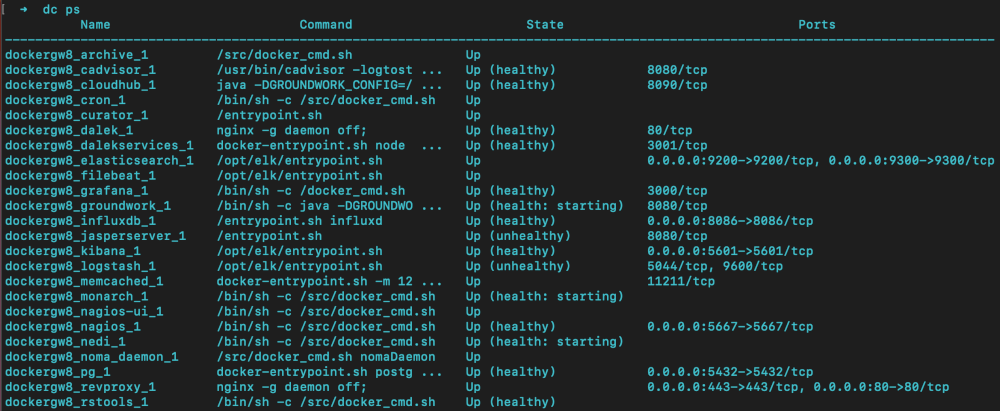
First, let’s take a look at how to connect to a Docker system running on the same machine where GroundWork is installed. Since version 8.0.0, GroundWork now runs as a Docker Compose application, so it’s a great example to work from. After installing GroundWork 8, you will see all the containers running that are used by the GroundWork application:
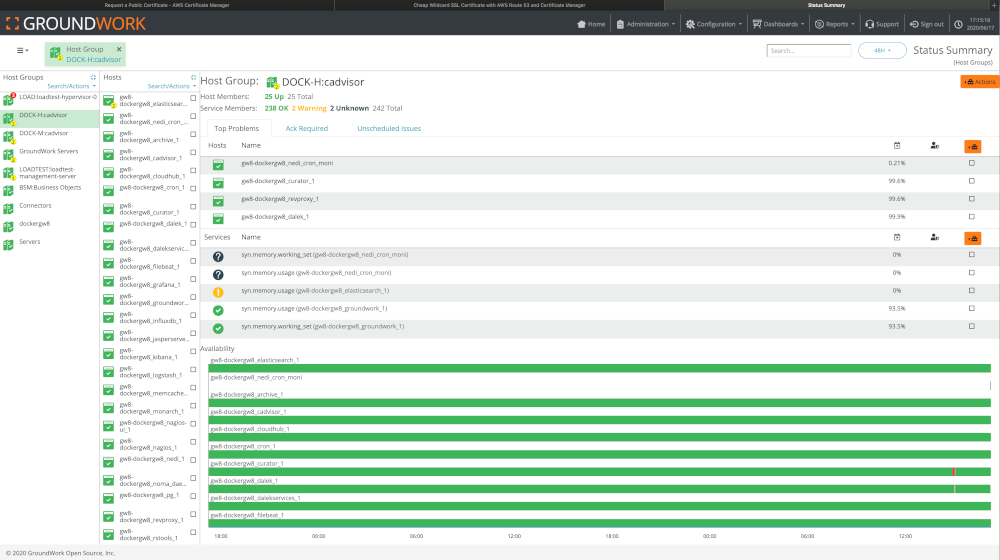
Out of the box, GroundWork monitors its own containers using the Docker connector. Let’s look at the GroundWork Status Summary dashboard. Here you will see all the containers above being monitored as traditional GroundWork inventory; as groups, hosts and services. In the image below we are looking at a Host Group view, where all the containers are members of a host group named DOCK-H:cadvisor:
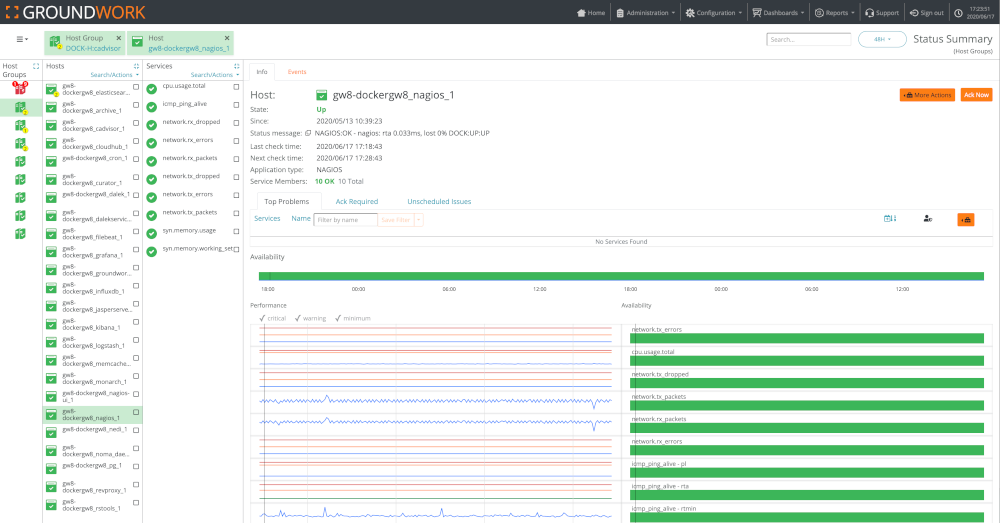
The Top Problems tab in the Host Group view sorts the containers (hosts) by their availability, with worst availability sorted to the top. Note, all the hosts in our image above are GroundWork containers. Let’s take a closer look at a single container in the Host view:
The host we are looking at here is the Nagios™ container (gw8-dockergw8_nagios_1). We can see this container’s status, check times, availability over time, as well as the performance metrics.
Docker provides metrics for:
Container CPU usage (cpu.usage.total)
Container Network throughput (network*)
Container Memory usage (memory*)
Container File System usage (filesystem*)
Container Disk usage (diskusage*)
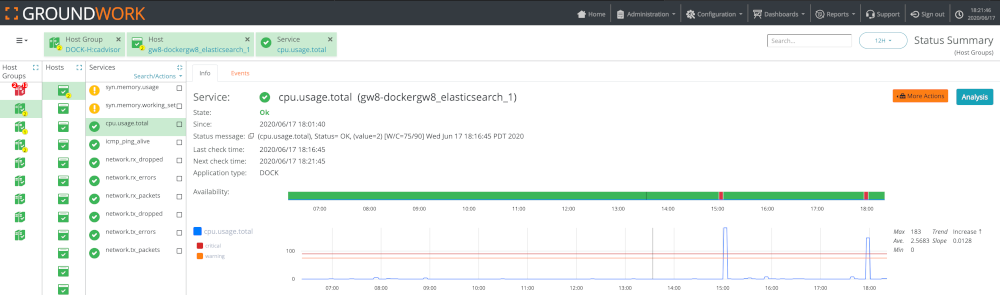
Here is the Service view for the Docker metric cpu.usage.total for the ElasticSearch container:
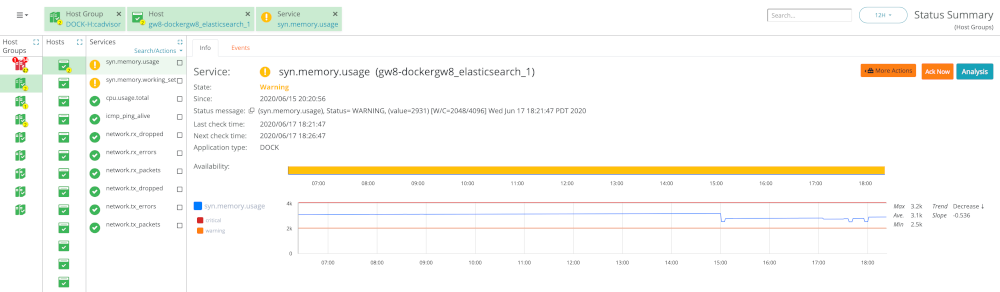
Additional metrics can be calculated based on the values of other metrics and formulae you specify. These calculated metrics are called synthetics. Here we have taken the Docker metric: memory.usage and using a GroundWork Cloud Hub formula, converted its value from bytes to megabytes: GW:MB2(memory.usage):
The red line represents a Critical threshold, whereas the orange line represents a Warning threshold. In this example, this metric is in a Warning state.
Notice the service named: icmp_ping_alive. This is not a Docker metric. It comes from Nagios. Nagios and the Docker connector are monitoring the same container, merging the monitoring by host name. This is an example of the Unified Monitoring feature in GroundWork: where metrics on a container or other monitored resource can originate from two or more different sources.
Next, let’s look at how to configure the Docker connector.
Configuring the Docker Connector
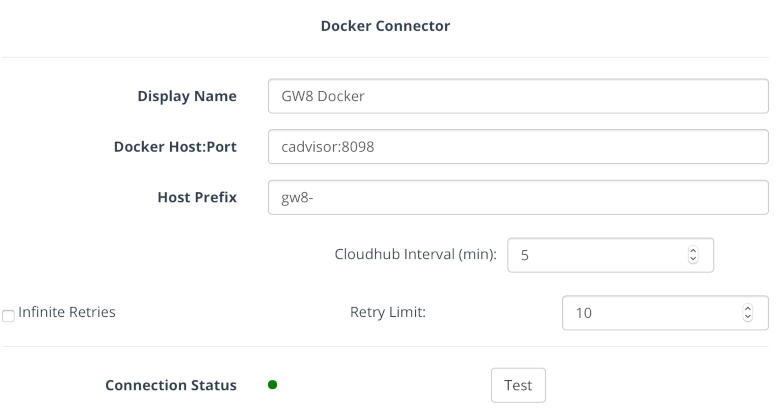
Making a connection to Docker is easy. Just point the connector at a server running CAdvisor on a standard port, click Test to make sure it works, and off you go!
Here we just point to the CAdvisor container, which is exposed to other containers in Docker with the name cadvisor on port 8098. Cloud Hub, running in another container, can connect directly to it using its Docker Compose service name. Note that GroundWork comes with CAdvisor installed in Docker Compose. If you are connecting to Docker running on another node in your network, ensure that you install CAdvisor into Docker on the other node so you can connect to it using it’s fully qualified domain name..
When you are monitoring multiple installations of Docker in your network, you will probably want to give each Docker node a host prefix. This will prefix the name of your containers to avoid collisions in the global network namespace. Unlike hosts in your network, container names are often the same on different nodes, and not unique across the entire network.
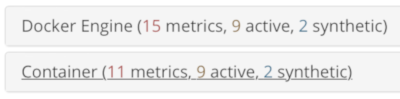
Since cloud providers often have hundreds of metrics, Cloud Hub automatically categorizes your metrics for you. We call these categories Views. GroundWork provides a set of custom-selected metrics and thresholds so you can immediately start monitoring your cloud infrastructure with a few clicks. This “convention over configuration” philosophy is seen throughout GroundWork Monitor. For advanced users, we continue to provide the ability to go deeper into configuration and make adjustments. The Docker connector provides two views of metrics:
In addition to monitoring individual container metrics, we can also monitor metrics across the entire Docker Engine. These metrics are total for all CPU usage, memory usage, network usage across the entire Docker instance.
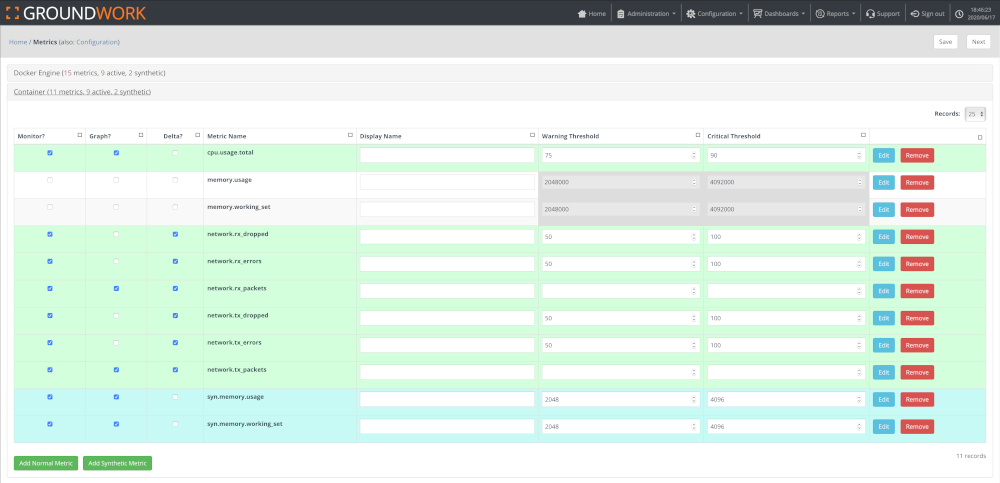
The metrics with the Monitor column checked will actually be monitored. You can use this view of the Metrics to quickly set Warning and Critical thresholds per metric:
Inventory Comes and Goes
Containers can be added to the Docker system. The Docker connector will automatically discover when new containers are added, or when containers are removed from the Docker deployment.
First, let’s take an example of adding a container. If we run:
docker run -d -P --name static-site prakhar1989/static-site
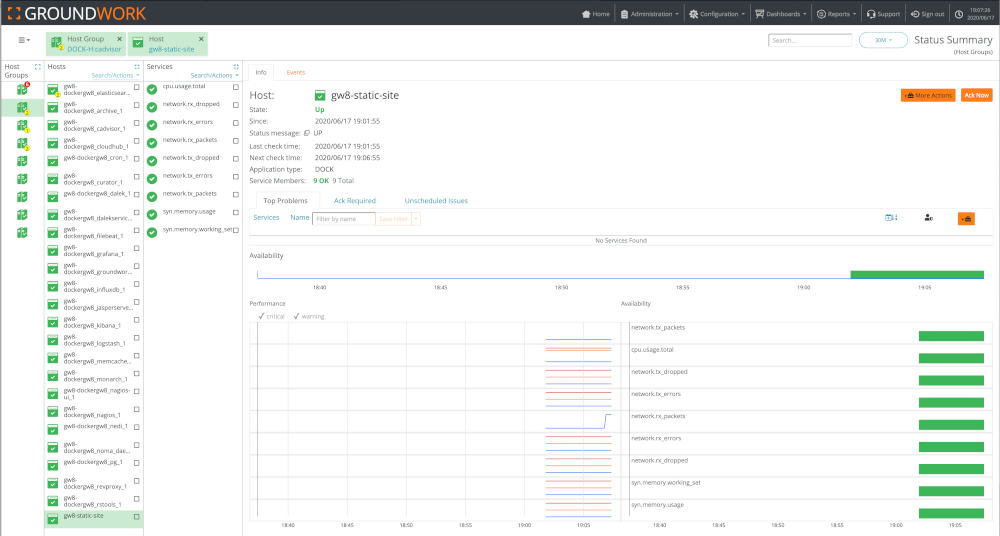
A container will be added to the Docker node. Soon after starting the static-site container, we will see it added to the inventory in the Status Summary dashboard:
The container name is prefixed by gw8-, as we configured in the configuration step.
Next, let’s remove the static-site container:
docker stop static-site
In a few moments, the static-site container is removed from the Status view inventory. Containers that come and go will appear and vanish, but the events they generate will be available in reports.
Monitoring Docker Compose Managed Containers
Docker Compose containers are no different than other Docker containers. Docker Compose makes it easier to bundle containers and distribute them as a single application. Here is a simple example of how to quickly start monitoring containers provisioned in Docker Compose, (this example requires Docker Compose to be installed).
Start up the WordPress™ application, consisting of two containers:
docker-compose up -d
Ensure the WordPress application is running:
docker-compose pswordpress_db_1 docker-entrypoint.sh mysqld Up 3306/tcp, 33060/tcp wordpress_wordpress_1 docker-entrypoint.sh apach ... Up 0.0.0.0:8586->80/tcp
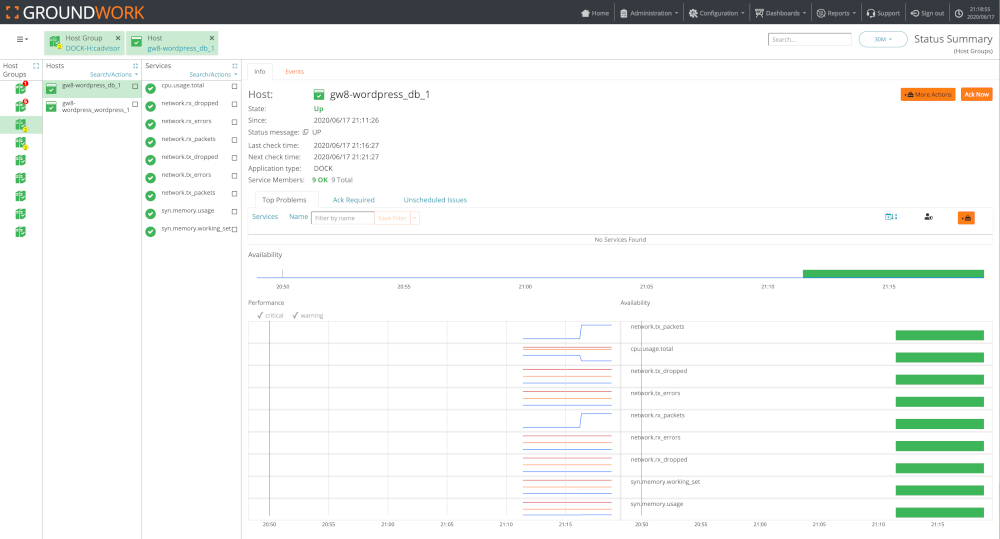
You’ll see in the Status Summary dashboard, two more containers being monitored:
Note, we filtered the containers in this screen by selecting the Search/ActionsHost filter.
To stop the WordPress application, type:
docker-compose down
You will see the two WordPress containers are removed from the Status Summary dashboard.
In Summary
The dynamic synchronization of monitored inventory is essential when working with Docker containers. The life cycle of containers can be much shorter than hosts or virtual machines. Creation of containers is easily scriptable, allowing you to quickly spin up and tear down containers as needed, in response to anything from monitoring feedback to system load. Synchronization of distributed container inventory will be explored again in an upcoming blog post, where we’ll have a close look at monitoring Kubernetes.
Other Posts...
The Value of Correlation
June 4, 2020
Why Correlation?
Data that is static or that behaves the same way day-to-day isn’t indicating aberrant behavior. Looking at the correlation of data from today with data from yesterday can tell you if today is different in some way: positive correlation means today is related to yesterday, particularly if deviation is high. Negative correlation with high variability means that today isn’t like yesterday at all.
Is something going wrong?
One of the problems you have when looking at operational data is that frequently, it’s not really obvious when something is going wrong. If you are within normal parameters, i.e., simple thresholds haven’t been crossed, then what can you tell about how a system is performing today? Read More
GroundWork 8.1.0 released!
June 3, 2020
GroundWork Monitor Enterprise 8.1.0 now available for download
This version of our Enterprise product supports distributed monitoring with multiple GroundWork servers in parent-child configurations, along with an update to our Log Bridge connection to Elasticsearch and Kibana.
Download 8.1.0
You can now download version 8.1.0 for free in a time-limited capacity. This free version will work for up to 200 devices for 3 months, and (unlike prior free versions) is 100% enabled, with many updates and new features.
We hope you find this new version useful and enjoy the innovations it brings.
This website uses cookies to improve your experience. We'll assume you're ok with this, but you can opt-out if you wish.AcceptRead More
Privacy & Cookies Policy
Privacy Overview
This website uses cookies to improve your experience while you navigate through the website. Out of these, the cookies that are categorized as necessary are stored on your browser as they are essential for the working of basic functionalities of the website. We also use third-party cookies that help us analyze and understand how you use this website. These cookies will be stored in your browser only with your consent. You also have the option to opt-out of these cookies. But opting out of some of these cookies may affect your browsing experience.
Necessary cookies are absolutely essential for the website to function properly. This category only includes cookies that ensures basic functionalities and security features of the website. These cookies do not store any personal information.
Any cookies that may not be particularly necessary for the website to function and is used specifically to collect user personal data via analytics, ads, other embedded contents are termed as non-necessary cookies. It is mandatory to procure user consent prior to running these cookies on your website.