Data that is static or that behaves the same way day-to-day isn’t indicating aberrant behavior. Looking at the correlation of data from today with data from yesterday can tell you if today is different in some way: positive correlation means today is related to yesterday, particularly if deviation is high. Negative correlation with high variability means that today isn’t like yesterday at all.
Is something going wrong?
One of the problems you have when looking at operational data is that frequently, it’s not really obvious when something is going wrong. If you are within normal parameters, i.e., simple thresholds haven’t been crossed, then what can you tell about how a system is performing today?
Compare same source
One way is to compare the data you are seeing to other data, and see if it’s related. Of course, you should always look at the whole picture if you can and try to see a pattern, but a little analysis can go a long way. This is especially true if you are comparing similar data, and what’s more similar than data that’s from the same source, but a different date or time?
Standard deviation
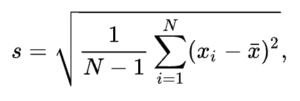
One easily accessible number that can be found from a single dataset (say, dropped packets on an interface, or inbound packets) is standard deviation. This is a measure of the sum of the squares of the differences of the points of data from their mean, or average. Actually, it’s the square root of 1/(N-1) (where N is the number of data points) times that sum, expressed like so:
Basically, this is a measure of the variability of that data. The bigger the s, the more varied the data is in value.
Looking at the standard deviation of today’s data vs yesterdays, for example, would give you an idea of whether the metric is bouncing around more today than yesterday. That could indicate a significant change as of today.
Or… not. The s value for yesterday might be the same as today, but the mean for today might be 200% of yesterdays. So obviously, it’s not enough.
What else can we look at that would capture a measure of how related today is to yesterday? Well, there is a number we can calculate and use (in combination with the standard deviation) to see the picture more clearly. That’s all we ask!
It’s the Measurements
Time series data is always based on, well, time. You can think of today’s time and yesterdays time as common, hour-by-hour, second-by second. What’s of interest for correlation isn’t the time difference, it’s the measurements.
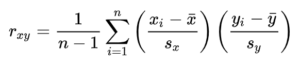
Let’s subtract time from the comparison (since it’s the same, a day apart), and concentrate on whether the measurements are related over that time. If we can match up measurements for a given time interval, we can treat them as data we can calculate the correlation of. The formula is more complex than that for standard deviation:
In simple terms, it’s 1/(N-1) times the sum of the product of the difference of each point in the first series over the first series standard deviation (s, remember) and the same difference over deviation for the second series.
“r” is always between -1 and 1. If we are comparing today to yesterday and r is negative, that means that yesterday’s values were low when today’s were high – so things are different. If it’s positive it means the opposite; values were high yesterday when they were also high today. Things were more the same. The closer to 1, the more similar the data, and the closer to -1 the more dissimilar.
Except if it’s too similar.
Correlation and Variability
Correlation isn’t much good on it’s own. You need to look at variability as well. If you have low correlation (r near zero) and low variability (s near zero), then you have data that pretty much didn’t change from a single central value. Like if dropped packets were zero all day, or maybe 1 or 2. Variability (standard deviation) would be low, and so would correlation, since the linear aspect of the data would be lost in the randomness.
In the case of higher variability, though, correlation is significant: that’s when you should pay attention, especially to highly negative correlation (r near -1) and high variability (bigger values of s). Something significantly divergent is going on in today’s data, as indicated by those metrics.
GroundWork Insight Dashboard Analysis
In GroundWork Monitor, we make these calculations for you on the Insight dashboard. Just click Analysis on the info panel of a metric you are interested in. Of course, we also calculate trend (least squares linear regression), and there’s a histogram of the time periods you are looking at, so you can get a visual comparison of the distribution of today with yesterday, and if you have it, the same day last week, last month, and last year.
It’s never the case that one or two numbers can tell you all you need to know, but we are giving you some interesting numbers to work with. We hope you can put them to good use.
This version of our Enterprise product supports distributed monitoring with multiple GroundWork servers in parent-child configurations, along with an update to our Log Bridge connection to Elasticsearch and Kibana.
Download 8.1.0
You can now download version 8.1.0 for free in a time-limited capacity. This free version will work for up to 200 devices for 3 months, and (unlike prior free versions) is 100% enabled, with many updates and new features.
Please join us Wednesday, June 10th at 10AM PST for a live Webinar introducing the latest version of GroundWork Monitor Enterprise, featuring an all new architecture for distributed monitoring with central control we call Parent/Child. We are excited to show you the work we have done, and to get your feedback. We think you will like what you see!
GroundWork Parent/Child provides a way to securely distribute monitoring servers in your enterprise, be they in the cloud, data center, or remote locations. We have new features for:
Fully centralized control of monitoring configurations
Fully centralized control of connection parameters
Ownership of unified monitoring resources by connection
Optional independent administration of Child servers in remote locations
Threshold overrides
Distribution of notifications
This website uses cookies to improve your experience. We'll assume you're ok with this, but you can opt-out if you wish.AcceptRead More
Privacy & Cookies Policy
Privacy Overview
This website uses cookies to improve your experience while you navigate through the website. Out of these, the cookies that are categorized as necessary are stored on your browser as they are essential for the working of basic functionalities of the website. We also use third-party cookies that help us analyze and understand how you use this website. These cookies will be stored in your browser only with your consent. You also have the option to opt-out of these cookies. But opting out of some of these cookies may affect your browsing experience.
Necessary cookies are absolutely essential for the website to function properly. This category only includes cookies that ensures basic functionalities and security features of the website. These cookies do not store any personal information.
Any cookies that may not be particularly necessary for the website to function and is used specifically to collect user personal data via analytics, ads, other embedded contents are termed as non-necessary cookies. It is mandatory to procure user consent prior to running these cookies on your website.