Cloud Service Monitoring with GroundWork Cloud Hub
April 14, 2020
Cloud Computing Services
Cloud Computing Services like AWS, Google Cloud and Microsoft Azure are revolutionizing IT infrastructures at a rapid rate. However, businesses have not completely adopted Cloud services, and many of us are still running hybrid on-premise and cloud solutions. The GroundWork solution is to unify all monitoring, whether it be on-premise or in the cloud. This article introduces you to the GroundWork Cloud Hub connector architecture, demonstrating how easy it is to start gathering cloud metrics and inventory from the most popular cloud computing platforms today.
GroundWork Cloud Hub
Cloud Hub is a connector architecture that gathers inventory and metrics from Cloud Computing sources. Traditional monitoring systems like Nagios worked with inventories of hosts and service checks on those hosts. With the cloud, the inventory is much more rich. Cloud services are made up of the entire spectrum cloud services:
VM Instances
Serverless Applications and Functions
Databases
Cloud Storage
Cloud Network Services
Machine Learning
And more services are being added over time.
Simply Select your Cloud Service
Cloud Hub supports the most popular cloud services out of the box. Adding a connection is as simple as selecting your cloud service.
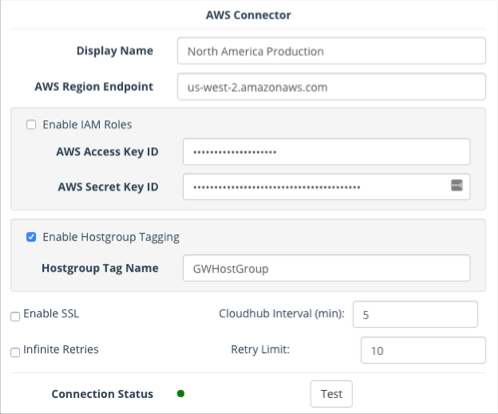
And then, add your connection credentials. Here we see how to configure an AWS connector. You just need to provide your AWS region endpoint and access keys, and the connection is ready to go.
Note that if you are running Cloud Hub on an AWS server, you don’t even need to provide credentials, you can simply check the box to Enable IAM Roles, and we automatically do the authentication for you.
Each connector usually has advanced features, such as creating host groups based on AWS tag names.
Categorized Views
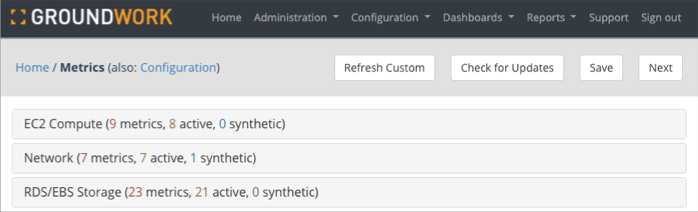
Since cloud providers often have hundreds of metrics, Cloud Hub automatically categorizes your metrics for you.
We call these categories Views.
Metrics and Thresholds
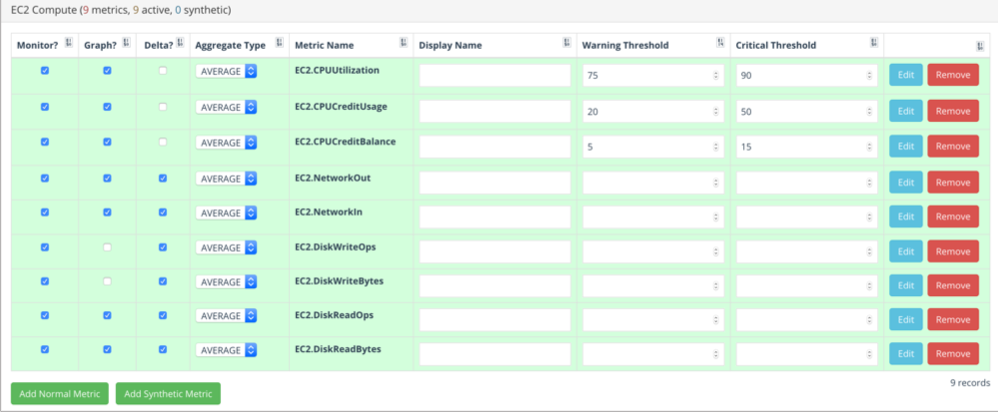
GroundWork provides a set of custom-selected metrics and thresholds so you can immediately start monitoring your cloud infrastructure with a few clicks. This convention over configuration philosophy is seen throughout GroundWork Monitor. For advanced users, we continue to provide the ability to go deeper into configuration.
Additional metrics are discovered by category and added to the list of monitored metrics:
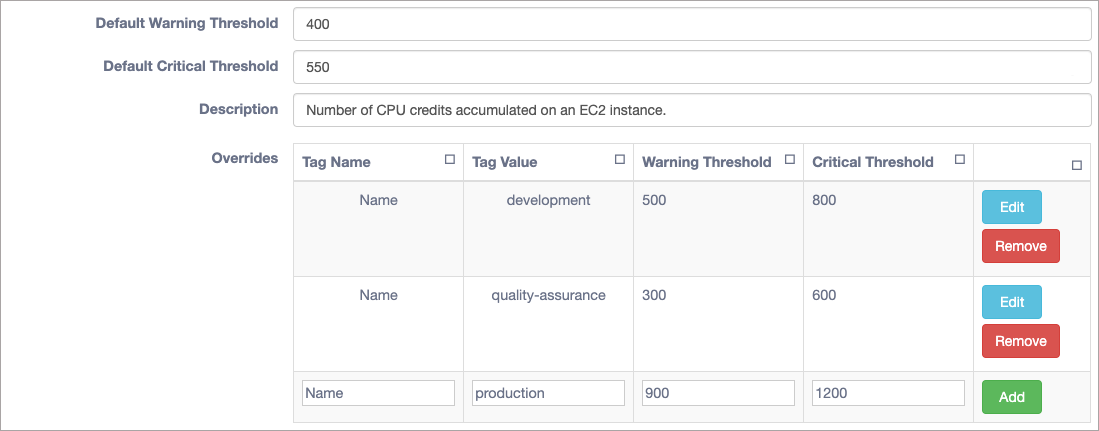
Metric thresholds can be configured for all hosts or per host:
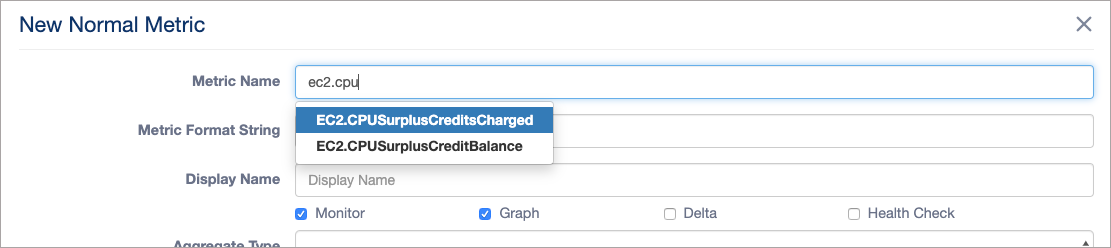
Synthetic Metrics
Metrics can also be aggregated to create new metrics. This type of metric is called a synthetic metric. Synthetic metrics are built upon expressions of existing metrics. A synthetic metric can be as simple as a math expression:
ELB.HealthyHostCount + ELB.UnHealthyHostCount
Cloud Hub also provides helper functions to perform common conversions like converting bytes to megabytes:
GW:MB2(memory.usage)GW:GB2(physical_memory_used)
Or more advanced functions to calculate percentage used:
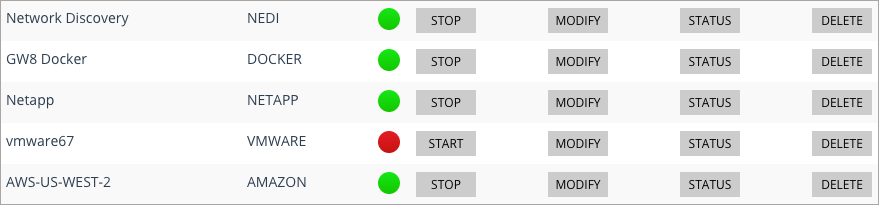
After creating your connector, you can start and stop it in the Cloud Hub administration window:
In an upcoming Blog post, we’ll have a closer look at the Docker connector, and see how Cloud Hub creates inventory and displays metrics in the GroundWork Monitor 8 Status Summary page.
How Unified Monitoring Can Help Make Your IT Life Easier!
April 7, 2020
Unified Monitoring provides real-time understanding of what is happening, every time and everywhere on the network, and everything connected to it. With Unified Monitoring, engineers are more able to support proactive identification of root causes and deploy the actions and resources needed to maintain the health and integrity of all connected IT assets.
As IT infrastructures rapidly evolve in scale and complexity, implementing an integrated and automated platform that monitors the entire IT infrastructure is a proven strategy for reducing service outages, increasing end-user and IT productivity, optimizing capital investment, and maintaining industry compliance—making IT easier than ever before.
To ensure the reliability that businesses expect, IT teams need unified visibility and actionable insight for diagnosing performance issues across the entire IT environment—both physical and virtual, both on-premises and in the cloud.
Collaborate with GroundWork to reach new customers and benefit from GroundWork Open Source marketing, selling, and technical resources.
GroundWork Partners
GroundWork Partners are in a unique position to offer their customers a single solution for all their IT monitoring needs. Competitive pricing means our software is the perfect tool for a range of customers, from SMB to the Fortune 500. Our short, predictable sales process makes it easy to grow your revenue with GroundWork Monitor.
This website uses cookies to improve your experience. We'll assume you're ok with this, but you can opt-out if you wish.AcceptRead More
Privacy & Cookies Policy
Privacy Overview
This website uses cookies to improve your experience while you navigate through the website. Out of these, the cookies that are categorized as necessary are stored on your browser as they are essential for the working of basic functionalities of the website. We also use third-party cookies that help us analyze and understand how you use this website. These cookies will be stored in your browser only with your consent. You also have the option to opt-out of these cookies. But opting out of some of these cookies may affect your browsing experience.
Necessary cookies are absolutely essential for the website to function properly. This category only includes cookies that ensures basic functionalities and security features of the website. These cookies do not store any personal information.
Any cookies that may not be particularly necessary for the website to function and is used specifically to collect user personal data via analytics, ads, other embedded contents are termed as non-necessary cookies. It is mandatory to procure user consent prior to running these cookies on your website.