Mitigating Alarm Fatigue with GroundWork Messenger
July 12, 2021
GroundWork Monitor Enterprise version 8.2.0 offers enhancements that build on the capabilities we have mentioned in past blogs. While all the dependencies, parent-child, and service and host dependencies are present as before, we have gone through our notification system and revamped it with an eye to making it easier to get the right alerts to the right people, with the right methods.
Alarm Fatigue
Alarms storms come with the territory of monitoring systems, and their causes and mitigation are the subject of a previous blog. Getting too many alerts can desensitize system administrators and cause issues to go unnoticed, despite receiving alerts related to the event. The important messages are drowned in a flood of irrelevant data. This is known as Alarm Fatigue. You can’t really blame operators for ignoring alerts that are usually not actionable, so the key is to get them the alerts that are actionable, and only those alerts.
Getting the Word Out
When something goes wrong, you need to let the right people know. But what do you tell them? And what do you tell them about? Not everything.
Aggregating Alerts
While messages about individual items changing state can be useful for determining the causes of a failure, when you get an alert you want it to be when enough of a problem has arisen that you should take a look at the details. You can create a model to make sure you are aware a consequential incident has just occurred using aggregation.
Use BSM
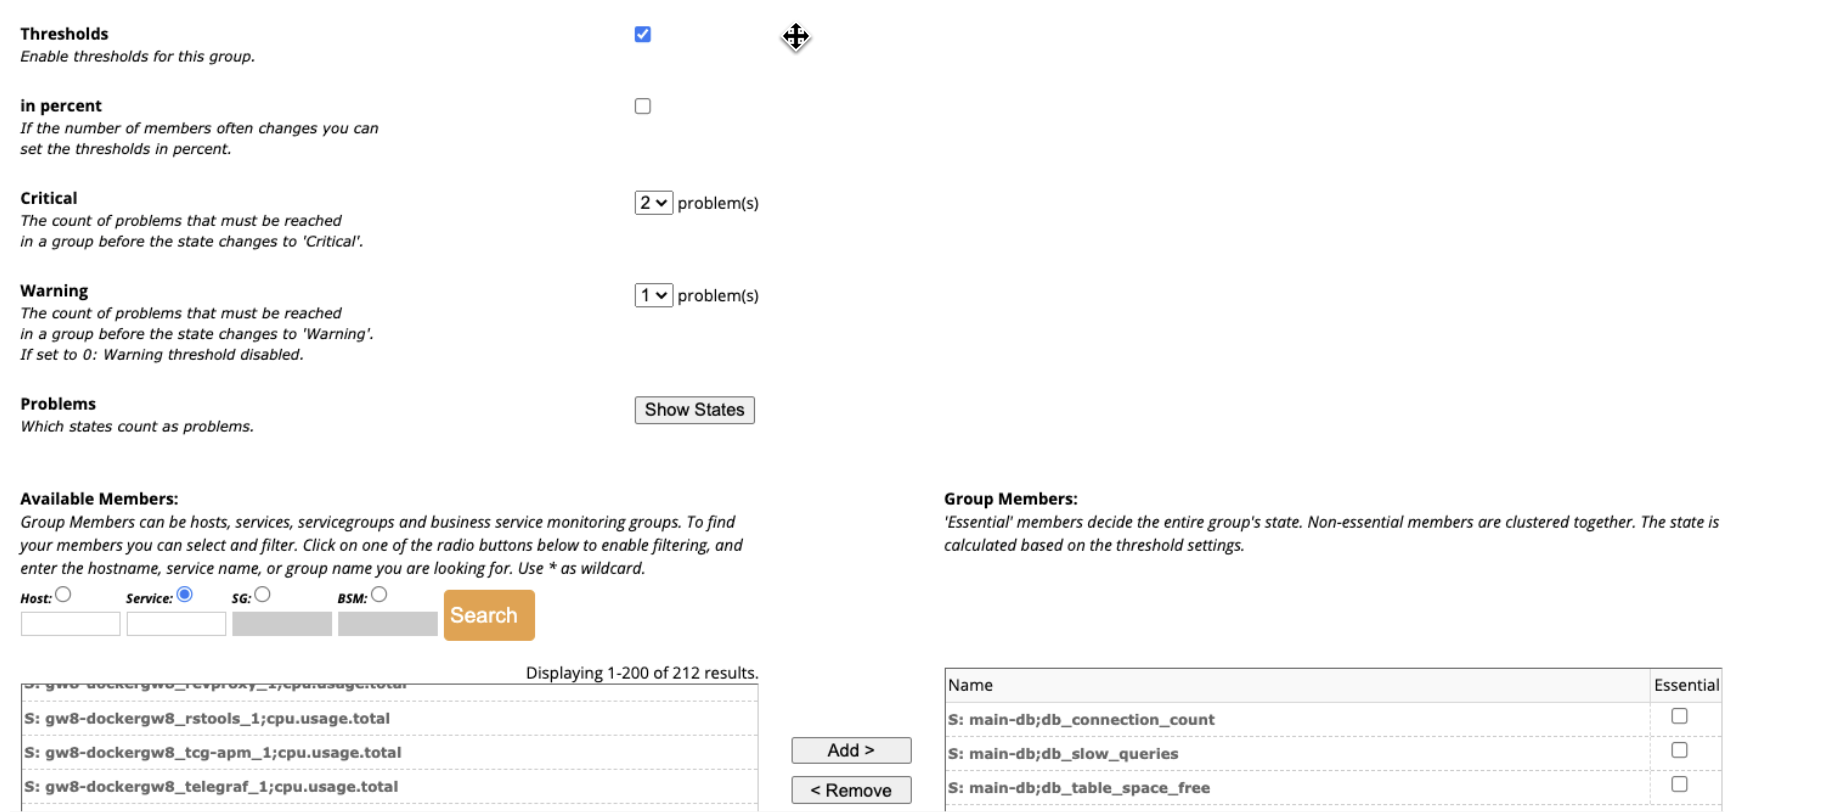
While we often use Business Service Monitoring (BSM) for dashboards or SLAs, its usefulness as an aggregator shouldn’t be ignored. You can take a group of resources such as end user experience monitors across different regions, or perhaps utilization of storage nodes in a cluster, and make a service monitoring the number of instances where the resources are over the warning threshold, for example. Such an alert would let you know there is a general problem, and cue you to the need to look at the specifics.
Who Needs to Know What When
In addition to aggregating alerts to model consequent incidents, you should also think about when you want that first “canary in a coal mine” alert, letting you know when things are about to get interesting. You have choices, and your choices matter.
What Happened?
If you set blanket policies for alerting on all services, then you will definitely get alarms storms and experience fatigue. This is unfortunately the easiest condition to configure – if you use wildcards for everything in your rule, you will be guaranteed to see everything.
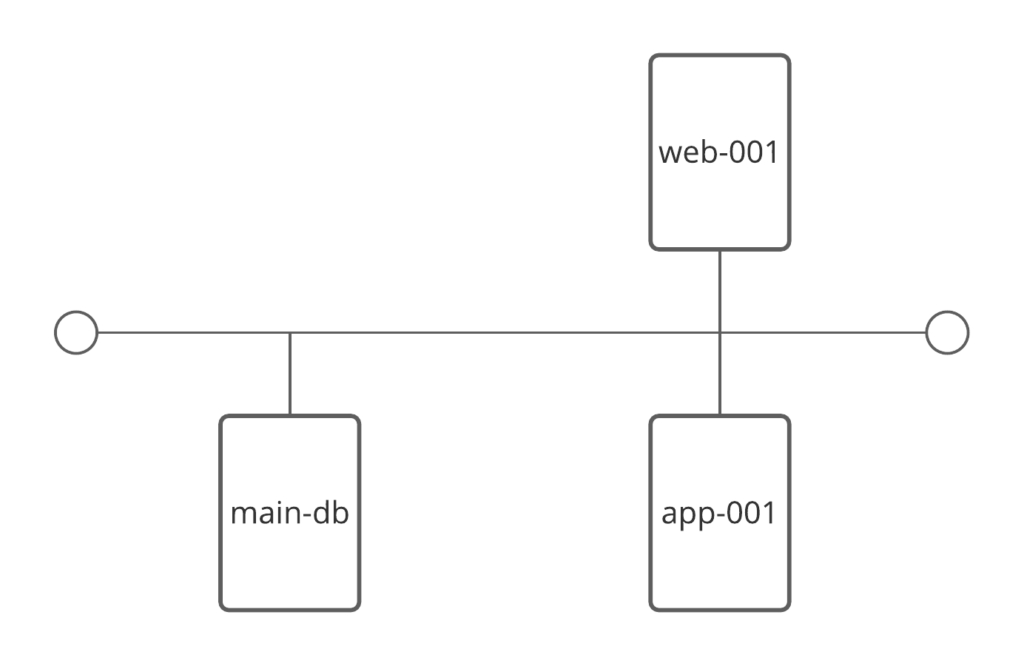
If you are a little careful in your selection however, you can filter the exact services and precise state transitions you want notifications for to get you early warning. For example, let’s say you have a web application with a database, an app server, and a web server, and you are monitoring all the usual points of interest: CPU, RAM, disk utilization on all the systems, table space and connections on the database, and the web pages served by the server with content validated that is fetched by the app server from the database. (You might also monitor a lot more, even the application’s internal queues, garbage collection, and other parameters, but let’s keep it simple for illustration purposes.) If connections are getting high on the database, that can indicate a potential utilization issue. Also if table space is low, and there are slow queries, in particular any two of these together. So you might want to use a BSM service to look for the confluence of two or more among this group of three:
If ANY of the systems are out of disk space, that’s a big problem. Similarly, a service that looks for one or more issues there is something you want to know. Similarly, the web interface having an actual error code would be a great simple check for serious issues. Consider adding simple aggregations and singleton checks like these to specific rules just for them.
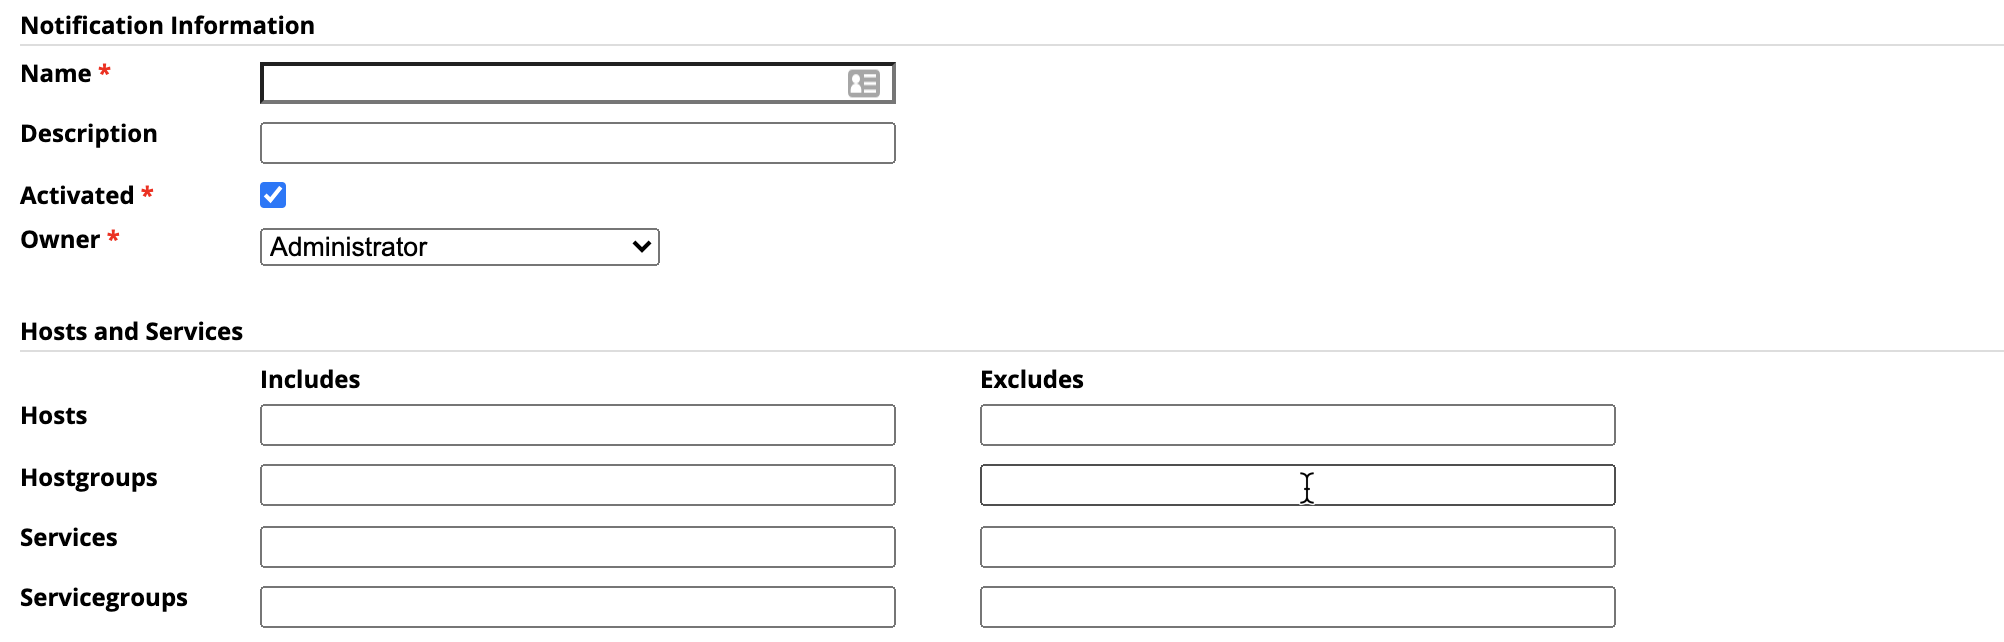
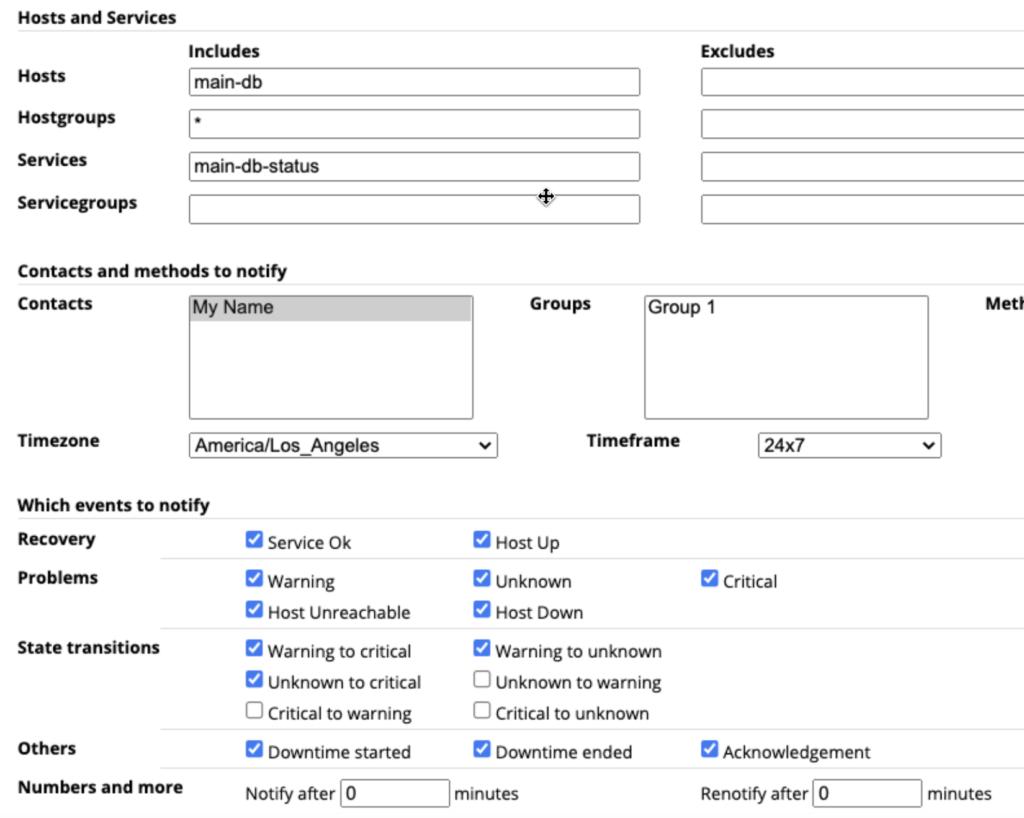
This shows the rule configuration for a specific host and service, no matter what hostgroups it may be in. In this case it’s super specific, and that’s what you want. You can have several rules, clearly named and differentiated to make sure the right people get the right messages, during the time they are actually awake and able to respond.
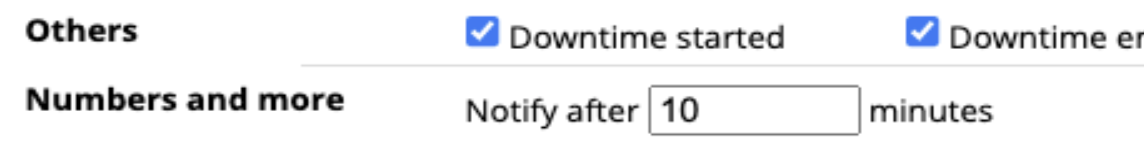
Delay First Send
Any service can have a bad day, or be transiently over threshold. CPU is notorious for spiking and recovering, for instance. If you decide to wait a bit before you send out an alert on CPU, you will get an alert only when the CPU hits a wall and stays there. If you are checking it every minute, you might want to wait 3 minutes before notifying. The Notify after setting will do that, and only notify if the service is still in the over-threshold condition:
Repeat Alerts
Careful with this one. Ideally, you should be able to tune your system down to the level where less than or just around 1% of your alerts are false positives. If you haven’t achieved this yet, it’s tempting to set up recurring notifications. Really though, you should pay attention to every notification, and not ignore them until they repeat. Use the Notify after instead! That said, you can always use Renotify after to have certain notifications repeat periodically until the condition gets better or is acknowledged:
Escalations
What if you send to a Slack channel but no one responds? Maybe no one is looking at Slack that day (really, that never happens!), and you need to send an SMS to a couple of people’s phones to make sure the issue is handled. Set up an escalation and select who and how the different contacts will get your texts.
Channels to Watch
Each rule in GroundWork Messenger can have one or more output channels. If you are watching a channel, you can monitor the alerts.
Email
It’s universal, and reliable. It’s also slow, but sometimes you need a long form. Check out the HTML templates we made to make your GroundWork Messenger messages pop! Totally customizable too, so make it work for you. This channel also is pretty insensitive to rate and volume, so if you must set up wildcard rules, use email.
SMS
We partnered with Vonage to bring you a really fast, economical, and global SMS service. You sign up and plug in the tokens, and your GroundWork servers do the sending. Short message templates in text form keep it simple, but you can still put all the critical data into yours. Since you pay by the message (though really not much) be especially careful with this channel – don’t flood it!
Slack
Ideal for DevOps, a Slack channel is a great way to see what your GroundWork server has to say. It’s perfect for those early warning messages, and you can have as many different channels as you need for different topics or groups. It will rate limit if flooded, so again this works best when you don’t generate alarm storms.
Ticketing
The future is an API (or anyway some of those letters). Seriously, the fastest way to get a message is at wire speed with a post to a ticketing app’s API. We didn’t want to limit you, so we just dropped in a cURL channel. You can adapt it to pretty much any ticketing system you want to use.
In Summary
Picking the right aggregation for service alerting and choosing specific services for early warning of high priority issues can reduce your overall alarm fatigue. Using the filtering, delay and repeat options, you can filter out noise, and choosing the right channels for alerts and escalations can get actionable messages out to the people who need them.
Major new version includes quick-start for automated Network Monitoring, supercharged Kafka-powered notification Engine, and APM features for comprehensive Unified Monitoring
SAN FRANCISCO, May 5, 2021 /PRNewswire/ — GroundWork Open Source, Inc., a leading provider of powerful IT infrastructure monitoring software, today announced the general availability of GroundWork Monitor Enterprise version 8.2.0, its flagship all-inclusive monitoring product. A major new version, the on-premises/in-cloud software package includes multiple containerized monitoring source applications, flexible automation for network monitoring, and innovative rapid-deployment notification integration options.
Application Monitoring with Spring Boot, Prometheus, and GroundWork Monitor
April 20, 2021
In our previous Blog, we introduced how we use Prometheus and the GroundWork Application Performance Monitoring (APM) connector to instrument a GoLang program to send metrics to GroundWork Monitor Enterprise. In this article, we continue with more Prometheus examples, but this time we demonstrate how to instrument a Java application with Spring Boot for easy monitoring. With just a few annotations, your Spring Boot application will generate metrics in the Prometheus Exposition format, and we will then show how easy it is to send those Spring Boot metrics to Groundwork Monitor.
This website uses cookies to improve your experience. We'll assume you're ok with this, but you can opt-out if you wish.AcceptRead More
Privacy & Cookies Policy
Privacy Overview
This website uses cookies to improve your experience while you navigate through the website. Out of these, the cookies that are categorized as necessary are stored on your browser as they are essential for the working of basic functionalities of the website. We also use third-party cookies that help us analyze and understand how you use this website. These cookies will be stored in your browser only with your consent. You also have the option to opt-out of these cookies. But opting out of some of these cookies may affect your browsing experience.
Necessary cookies are absolutely essential for the website to function properly. This category only includes cookies that ensures basic functionalities and security features of the website. These cookies do not store any personal information.
Any cookies that may not be particularly necessary for the website to function and is used specifically to collect user personal data via analytics, ads, other embedded contents are termed as non-necessary cookies. It is mandatory to procure user consent prior to running these cookies on your website.


 GroundWork Monitor Enterprise version 8.2.0 offers enhancements that build on the capabilities we have mentioned in past blogs. While all the dependencies, parent-child, and service and host dependencies are present as before, we have gone through our notification system and revamped it with an eye to making it easier to get the right alerts to the right people, with the right methods.